
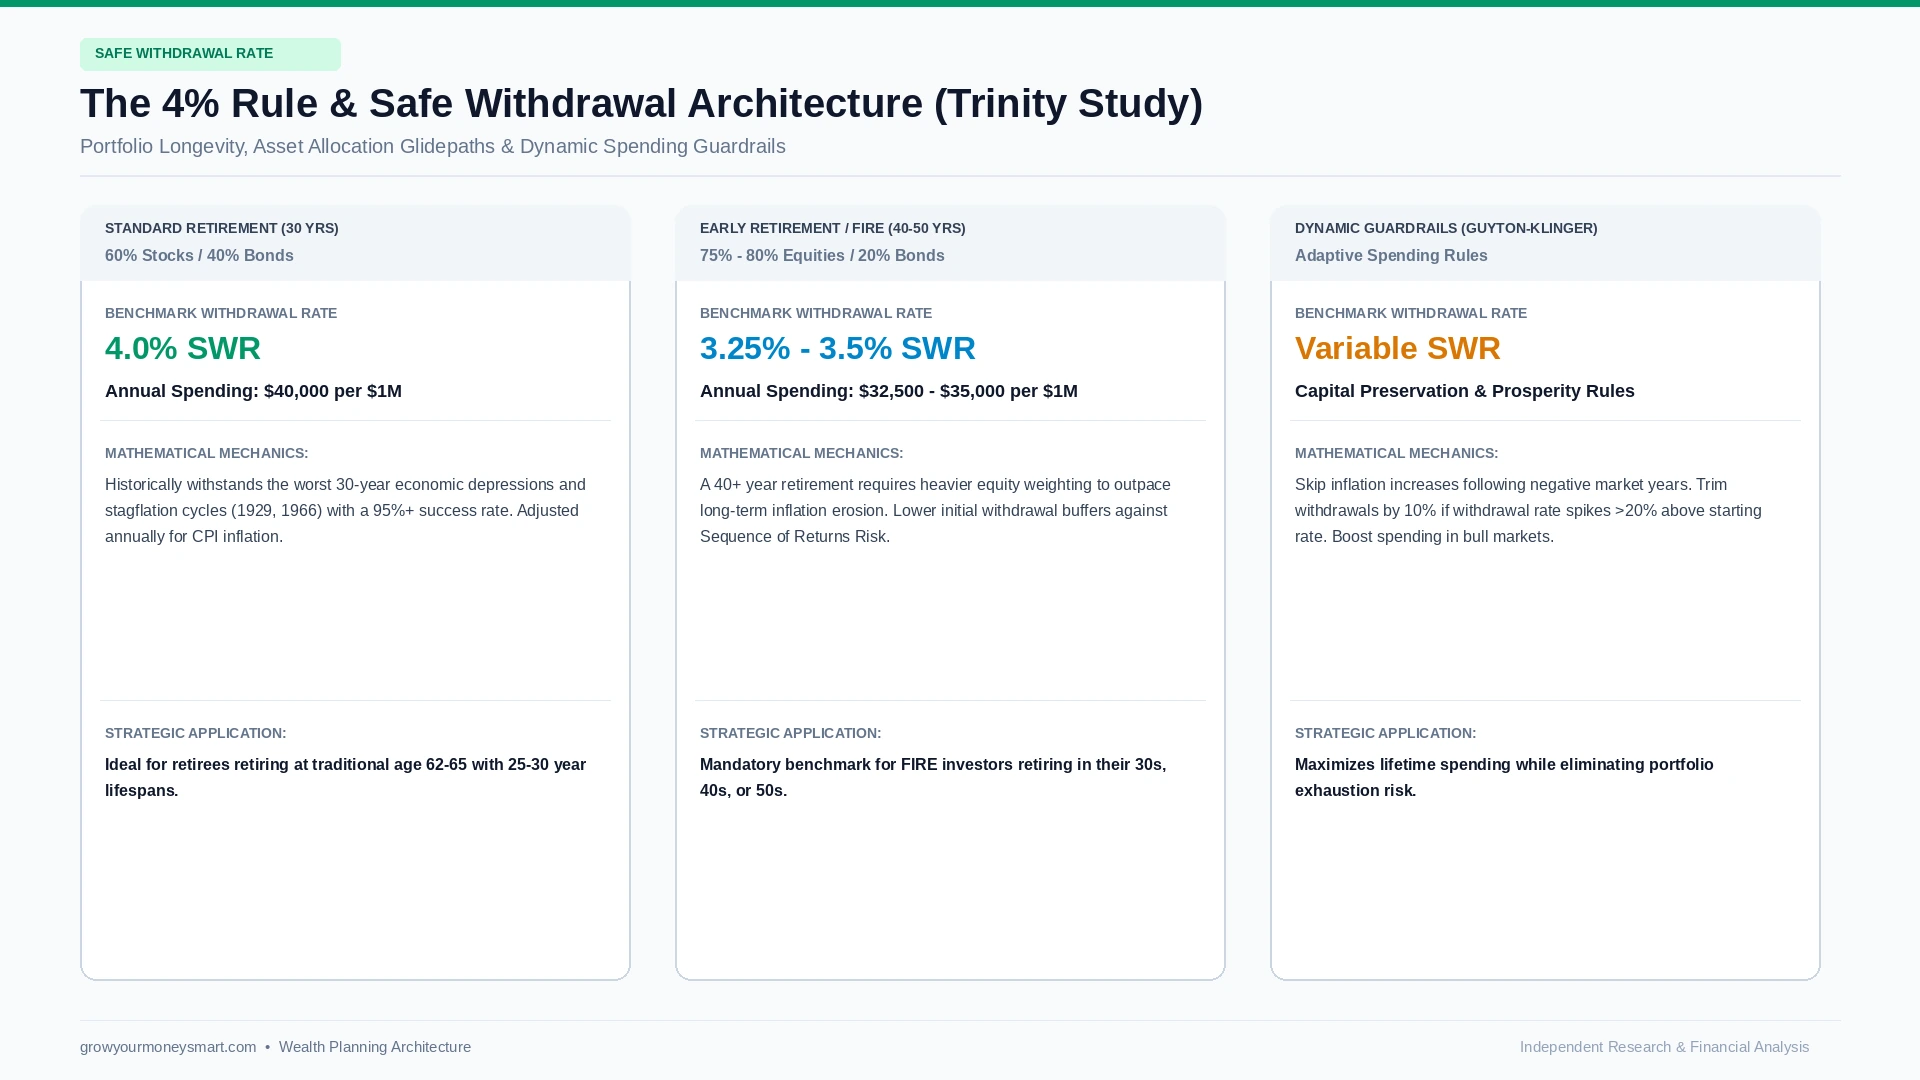
The 4% Rule states that a retiree can safely withdraw 4% of their total invested portfolio during their first year of retirement, adjusting subsequent annual withdrawals for inflation, with a 95%+ historical probability that the nest egg will survive at least 30 years without running out of money. First proven in William Bengen’s landmark 1994 research and validated by the Trinity Study, modern 2026 financial analysis recommends a more conservative 3.25% to 3.5% safe withdrawal rate (SWR) for early retirement horizons spanning 40 to 50 years.
Planning for retirement is fundamentally a transition from wealth accumulation to sustainable portfolio distribution. For decades, the central anxiety of every pre-retiree has remained unchanged: How much money can I withdraw each year without risking running out of cash before I run out of breath?
The answer that transformed modern wealth management is known worldwide as The 4% Rule (or Safe Withdrawal Rate). While often summarized as a simple arithmetic formula, applying the 4% rule in today’s economic landscape requires a deep understanding of historical market stress tests, inflation mechanics, sequence of returns risk, and dynamic spending guardrails. Whether you are aiming for traditional retirement at age 65 or targeting early financial independence through the FIRE (Financial Independence, Retire Early) movement, this master architecture provides the complete mathematical roadmap to protecting your nest egg.
Origins of The 4% Rule: William Bengen and the Trinity Study
Prior to the mid-1990s, financial advisors commonly relied on simple average market returns to project retirement spending. If the stock market historically returned 7% to 8% annually, conventional wisdom assumed a retiree could safely withdraw 7% or 8% each year. This naive approach proved disastrous during prolonged bear markets, as it failed to account for market volatility and the order of investment returns.
In 1994, MIT aeronautical engineer turned certified financial planner William Bengen published a groundbreaking paper in the Journal of Financial Planning titled “Determining Withdrawal Rates Using Historical Data.” Bengen analyzed historical rolling 30-year market periods dating back to 1926, deliberately testing retirement dates during the worst economic catastrophes in modern history—including the Great Depression of 1929 and the brutal stagflation crash of 1973–1974.
Bengen discovered that across every historical 30-year window, a portfolio split between 50% to 75% large-cap U.S. equities and intermediate-term government bonds could sustain a starting withdrawal of 4.15%, adjusted annually for inflation, without ever running out of capital. In 1998, three professors at Trinity University (Cooley, Hubbard, and Walz) expanded upon Bengen’s work across thousands of simulations, popularizing what is now universally known as the Trinity Study.
How the Math of The 4% Rule Actually Works
A frequent misconception is that retirees withdraw exactly 4% of their remaining portfolio balance every single year. This is completely incorrect. If your portfolio drops during a market crash, withdrawing a flat 4% of the reduced balance would force you to cut your living expenses drastically, creating intense lifestyle volatility.
Under the authentic Bengen/Trinity framework, The 4% Rule calculation happens only once—on the very first day of retirement. In subsequent years, your withdrawal dollar amount is adjusted strictly by the rate of inflation (measured by the Consumer Price Index, or CPI), completely independent of current market fluctuations.
- Year 1 (Starting Portfolio: $1,000,000): You withdraw exactly 4% of your starting capital, which equals $40,000. Your remaining $960,000 stays invested across broad-market index funds and bonds.
- Year 2 (Annual Inflation = 3.0%): Regardless of whether the stock market gained 20% or lost 15%, you adjust your initial $40,000 withdrawal by 3.0% CPI inflation. Your Year 2 withdrawal is
$40,000 × 1.03 = $41,200. - Year 3 (Annual Inflation = 2.5%): In Year 3, inflation increases by 2.5%. Your Year 3 withdrawal is
$41,200 × 1.025 = $42,230.
This dynamic adjustment guarantees that your real purchasing power remains 100% stable, ensuring you can purchase the exact same basket of goods and services regardless of macroeconomic inflationary pressures. For a comprehensive look at how inflation erodes savings over time, explore our analysis on how inflation erodes retirement savings.
Video Analysis: Is The 4% Rule Dead in 2026?
To see how financial researchers and portfolio managers pressure-test The 4% Rule against modern bond yields, stock valuations, and long-term life expectancies, watch this deep dive analysis from portfolio manager Ben Felix:
Sequence of Returns Risk: The Hidden Threat to Safe Withdrawal Rates
Why does a 5% or 6% withdrawal rate fail so frequently when the S&P 500 historically averages roughly 10% annual nominal returns? The answer lies in Sequence of Returns Risk (SRR).
During the accumulation phase of your career, the order of market returns does not matter—only the long-term compound average determines your ending wealth. However, once you enter the distribution phase and begin liquidating shares for living expenses, the timing of market downturns becomes existential.
If you retire into a severe bear market (such as 2000–2002 or 2008), you are forced to sell stocks at depressed valuations to meet your $40,000 baseline spending needs. This locks in catastrophic capital losses, permanently impairing your portfolio’s share count. When the market inevitably recovers, your depleted asset base lacks the critical mass required to compound back to health.
To defend against Sequence of Returns Risk, institutional wealth managers utilize two proven defensive architectures:
- The Cash Buffer (1 to 2 Years): Holding 12 to 24 months of baseline living expenses in an FDIC-insured high-yield savings account or money market fund. During bear markets, withdrawals are funded entirely from cash, allowing equities time to recover without forced liquidations. Review our Emergency Fund & HYSA Master Guide to structure your liquidity tier.
- The Bond Tent (Rising Equity Glidepath): Increasing bond and fixed-income allocations to 40%–50% during the 5 years immediately preceding and following your retirement date, then gradually drifting back toward equities as your portfolio navigates the critical fragility window.
The Early Retirement / FIRE Dilemma: Why The 4% Rule Needs Modification
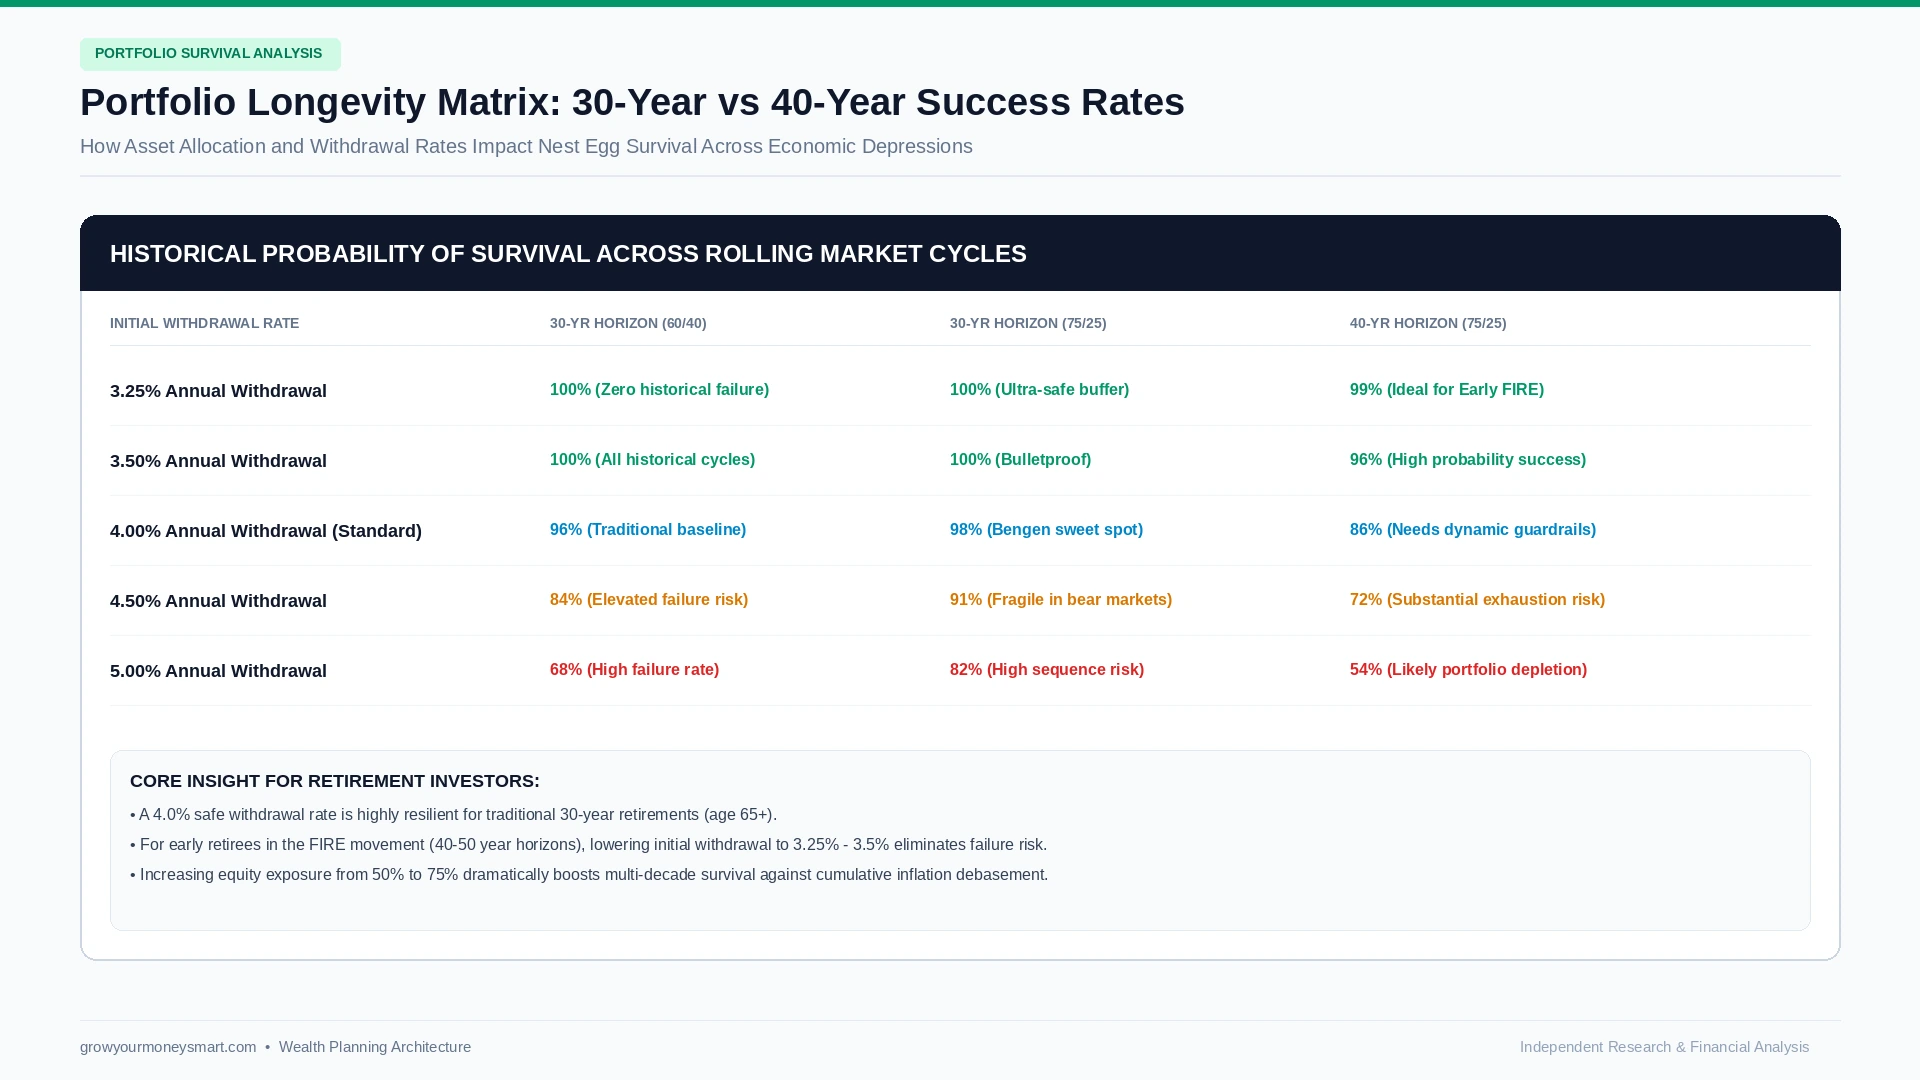
The original Trinity Study assumed a traditional 30-year retirement lifespan (e.g., age 65 to age 95). However, members of the Financial Independence, Retire Early (FIRE) movement frequently retire in their 30s, 40s, or 50s, requiring their capital to sustain them for 40, 50, or even 60 years.
Extending a retirement horizon from 30 years to 50 years introduces dramatic mathematical changes:
Notice that for longer horizons, your equity allocation must actually increase rather than decrease. Over four to five decades, inflation is a far more lethal predator than short-term market volatility. High-quality broad-market equity index funds—such as those structured in the Bogleheads 3-Fund Portfolio—provide the real compounding power needed to overcome multi-decade dollar debasement.
Modern Dynamic Spending Rules: Guyton-Klinger Guardrails
In the real world, human beings do not blindly increase their spending during severe economic crashes while watching their portfolios decline. Modern financial planners frequently implement Dynamic Withdrawal Strategies, the most prominent being the Guyton-Klinger Guardrail Framework.
Developed by financial planner Jonathan Guyton and computer scientist William Klinger, this system replaces static inflation adjustments with responsive rules that adapt to portfolio performance:
- The Capital Preservation Rule: If your current withdrawal rate rises by more than 20% above your starting rate (e.g., an initial 4.0% rate spikes to 4.8% due to a severe market slump), cut your next year’s spending by a modest 10%. This minor reduction immediately prevents portfolio ruin.
- The Prosperity Rule: If strong market gains push your current withdrawal rate more than 20% below your starting rate (e.g., dropping to 3.2%), reward yourself by boosting your annual spending by 10%.
- The Inflation Skip Rule: If your portfolio generates a negative total return in the previous calendar year, freeze your spending and skip the annual inflation raise entirely.
Empirical research shows that adopting simple dynamic guardrails allows retirees to begin with a higher initial withdrawal rate (often 4.5% to 5.0%) while maintaining a virtually 100% historical safety score. To understand how your personal milestone targets align with these rules, consult our guide on the 5 stages of the retirement plan lifecycle.
Frequently Asked Questions: The 4% Rule
No. The 4% rule applies exclusively to your invested investment portfolio. To calculate your portfolio target, subtract guaranteed annual income (Social Security, pensions, annuities) from your total annual living expenses, and apply The 4% Rule (or multiply by 25) only to the remaining gap.
The 4% rule is mathematically designed to withstand severe market crashes; both the 1929 Great Crash and 1970s stagflation are baked into its 95%+ historical survival rate. However, using a 1-to-2-year cash buffer or pausing inflation adjustments during downturns significantly increases safety.
The original 4% rule tested a 30-year retirement window. Early retirees retiring in their 30s or 40s face a 40-to-50-year horizon. Over 50 years, the probability of encountering two or more severe multi-year bear markets rises, making a 3.25% to 3.5% withdrawal rate significantly safer.
No. Bengen’s original studies and the Trinity Study used raw index returns with zero advisory or fund fees. If you pay a 1% advisory fee or high expense ratio mutual funds, your effective withdrawal rate jumps from 4% to 5%, significantly degrading portfolio survival. Use low-cost index funds with expense ratios under 0.05%.
Taxes must be treated as a living expense. If your annual lifestyle expenses are $40,000 and you project $6,000 in federal/state income taxes, your total required withdrawal is $46,000. At a 4% withdrawal rate, you will need a portfolio of $1,150,000 ($46,000 × 25) rather than $1,000,000.
Yes. Under the Guyton-Klinger “Prosperity Rule,” if market growth causes your current withdrawal rate to drop more than 20% below your initial rate (e.g., under 3.2%), you can safely increase your withdrawal by 10% to enjoy your surplus capital.
William Bengen’s 1994 paper focused on finding the single lowest historical withdrawal rate that never failed (SAFEMAX, calculated at 4.15%). The 1998 Trinity Study expanded Bengen’s work across rolling multi-decade periods and established statistical probability tables showing percentage odds of success across various stock/bond splits.
Healthcare costs typically rise faster than general CPI inflation. Retirees should build an explicit out-of-pocket medical reserve into their baseline spending, or fund healthcare using a dedicated Health Savings Account (HSA) to prevent health shocks from breaking their withdrawal guardrails.

Jaiveer Hooda is a personal finance researcher and the founder of Grow Your Money Smart. With a background in computer engineering, he approaches money the way an engineer approaches any complex system — through data analysis, mathematical modeling, and ruthless optimization.
He built this platform on a single conviction: financial freedom is not a matter of luck. It is a system that can be designed, tested, and executed by anyone willing to follow the right blueprint. Every strategy published here is researched to the numbers, not written to the trend.
Expertise: Debt elimination · Retirement planning · Passive income · Budgeting systems
Connect: Pinterest | growyourmoneysmart.com | Contact Us