
Mathematically, Lump Sum investing beats Dollar-Cost Averaging (DCA) approximately 68% of the time across global market history because equity markets trend upward over time and sitting in cash creates negative drag. However, psychologically, Dollar-Cost Averaging is the superior emotional strategy for investing sudden windfalls (bonuses, inheritances, or home sales) because it eliminates the devastating regret of buying right before a market crash. The optimal real-world compromise is a hybrid 3- to 6-month DCA plan, parking uninvested cash in a 4%+ High-Yield Savings Account while automatically deploying equal monthly installments.
30-Second Executive Summary for Beginners
- The Mathematical Truth: Groundbreaking research by Vanguard and Morningstar confirms that investing a lump sum immediately yields an average of 1.5% to 2.3% more over a 12-month period than staggering purchases.
- The Behavioral Trap: If an investor lumps $100,000 into the market on Monday and a surprise correction drops it to $85,000 on Friday, panic often causes them to sell at the bottom—permanently destroying wealth.
- Salary DCA vs Windfall DCA: Investing your bi-weekly paycheck is natural dollar-cost averaging; holding a large cash windfall in your checking account out of fear is “market timing.”
- The 6-Month Hard Limit: If you choose to dollar-cost average a windfall, never drag the process beyond 6 to 12 months, as cash drag compounds severely against long-term inflation.
Imagine you just received a sudden sum of money: an annual work bonus, a legal settlement, the proceeds from selling a property, or an inheritance from a relative. You have $50,000 or $100,000 sitting in your checking account, ready to build long-term wealth.
Suddenly, intense psychological paralysis strikes. Stock market headlines warn of economic uncertainty, interest rate volatility, and potential recessions. A voice in your head whispers: “What if I invest all this cash today, and the market crashes 20% next week? Shouldn’t I stagger my purchases slowly over time?”
This classic dilemma pits Lump Sum Investing (LSI) against Dollar-Cost Averaging (DCA). It is the ultimate collision between mathematical financial theory and human behavioral psychology. In this comprehensive guide, we dissect the historical data, simulate real-world windfall outcomes, and provide an actionable hybrid framework to deploy your capital with zero emotional regret. If you are preparing to deploy capital into broad index funds, also review our master blueprints on How to Invest in the S&P 500, The 3-Fund Portfolio, and ETFs vs Index Funds.
Portfolio Manager Ben Felix breaks down academic research, Vanguard historical win rates, and why lump-sum investing mathematically outperforms DCA 68% of the time.
The Core Showdown: Mathematical Probability vs Behavioral Emotion
To evaluate these two approaches objectively, we must first separate cold statistical mathematics from human emotions:
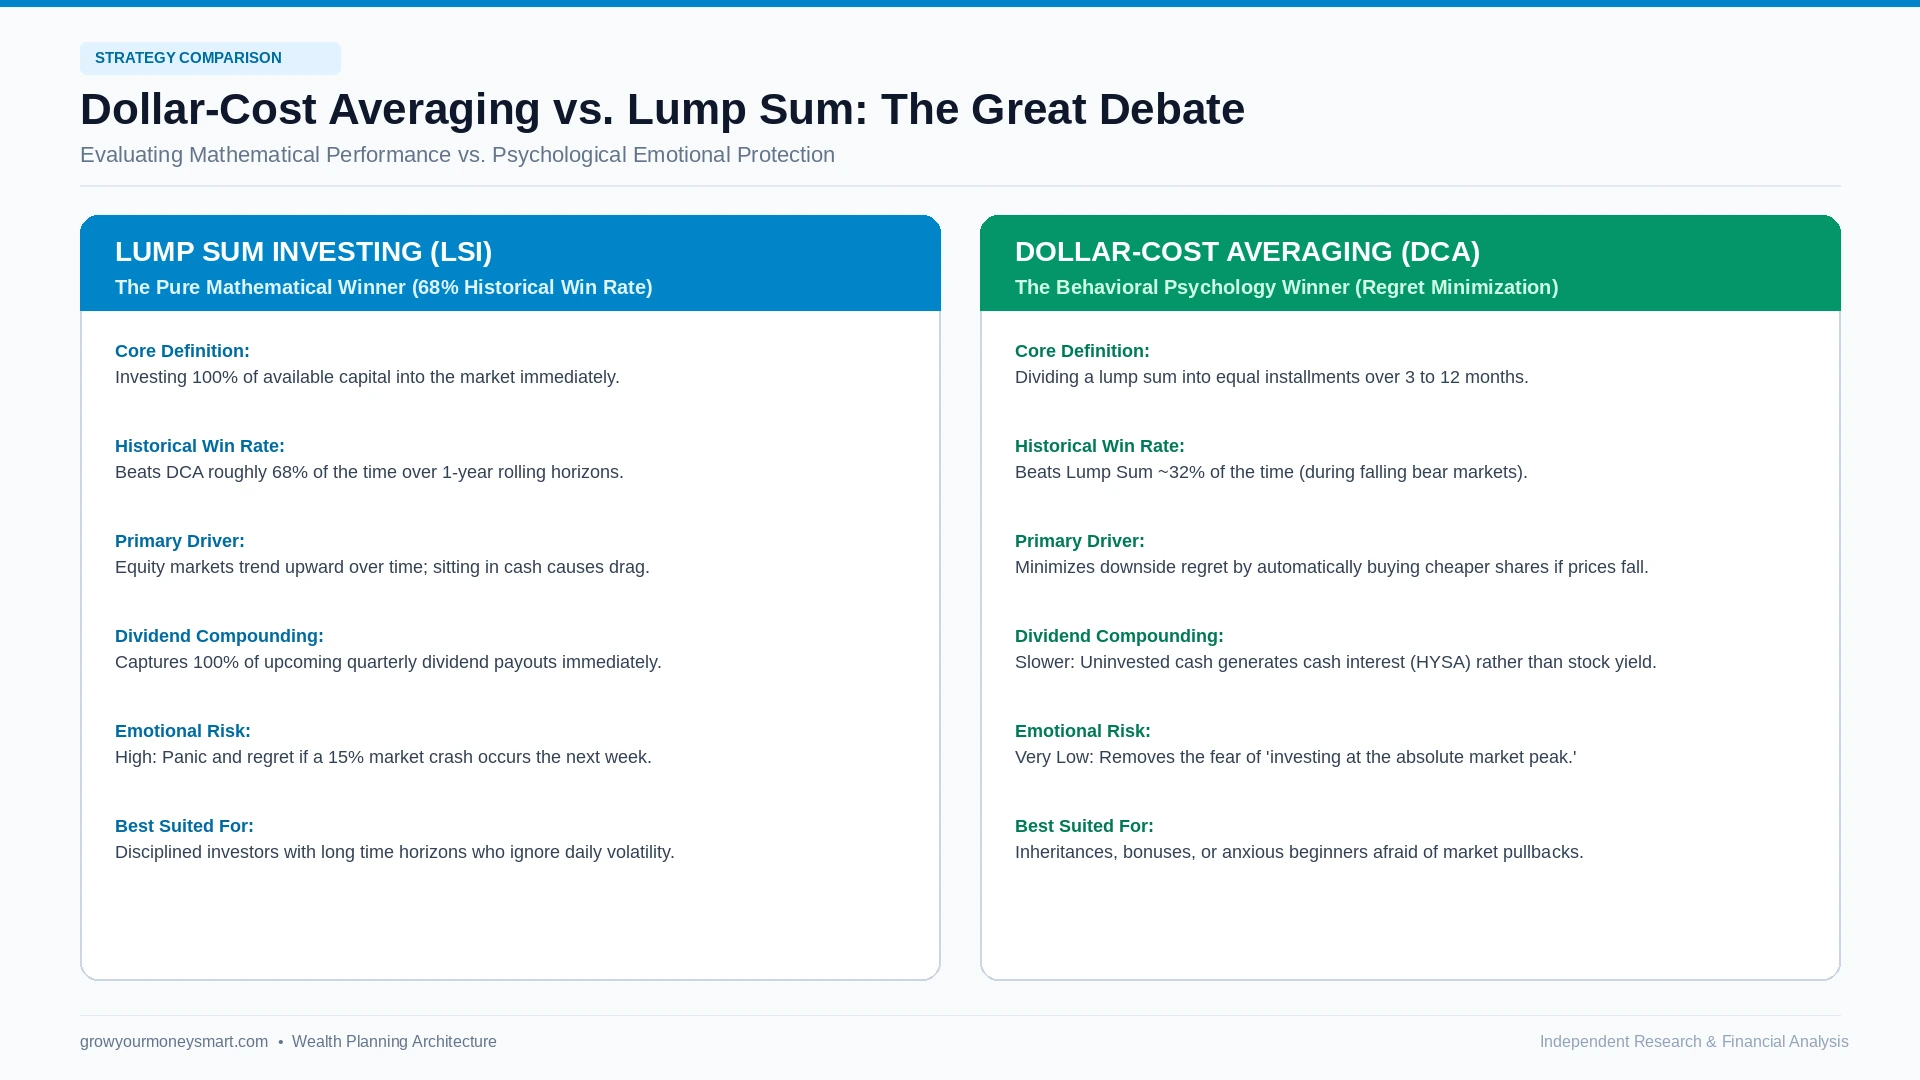
The Mathematical Reality: Why Lump Sum Wins 68% of the Time
In a landmark empirical study conducted by The Vanguard Group examining rolling 12-month historical periods across the United States, the United Kingdom, and Australia, researchers found that Lump Sum investing generated higher terminal wealth roughly 68% of the time compared to 12-month dollar-cost averaging.
Why does this happen? The reason is fundamentally simple:
- The Equity Risk Premium: Over long horizons, stocks rise far more often than they fall. Across historical U.S. market history, the stock market finishes in positive territory in roughly 73% of all calendar years.
- Cash Drag: When you dollar-cost average a lump sum over 12 months, your average dollar spends 6 months sitting on the sidelines in cash. Because equities trend upward, you are effectively betting that the market will decline or stay flat while you wait. By the time your final installments deploy in Month 9 or 12, you are frequently forced to buy shares at substantially higher prices.
- Dividend Capture: Lump sum investing instantly puts 100% of your capital to work, capturing full quarterly dividend distributions right away—such as those earned in a dividend investing strategy.
The Behavioral Defense: Why DCA Is Essential Emotional Insurance
If lump sum investing wins roughly two-thirds of the time, why would anyone ever dollar-cost average? The answer lies in loss aversion and regret minimization.
Nobel Prize-winning behavioral economists have proven that the psychological pain of losing $10,000 is twice as intense as the joy of gaining $10,000. If an investor deposits $100,000 as a lump sum and the market rises 10%, they feel mildly pleased. But if they deposit $100,000 and the market unexpectedly plunges 20% the following month, they experience unbearable panic, question their entire financial plan, and often commit the fatal mistake of selling out at the bottom.
Dollar-cost averaging acts as psychological insurance. If the market surges after you start, you are glad you got some money in. If the market crashes, you celebrate because your upcoming monthly installments will buy heavily discounted shares. DCA transforms market crashes from terrifying disasters into lucrative buying opportunities.
Simulating a $100,000 Windfall Across 3 Market Regimes
To see how this works in real life, let us simulate what happens to a $100,000 windfall deployed across three distinct 12-month market environments:
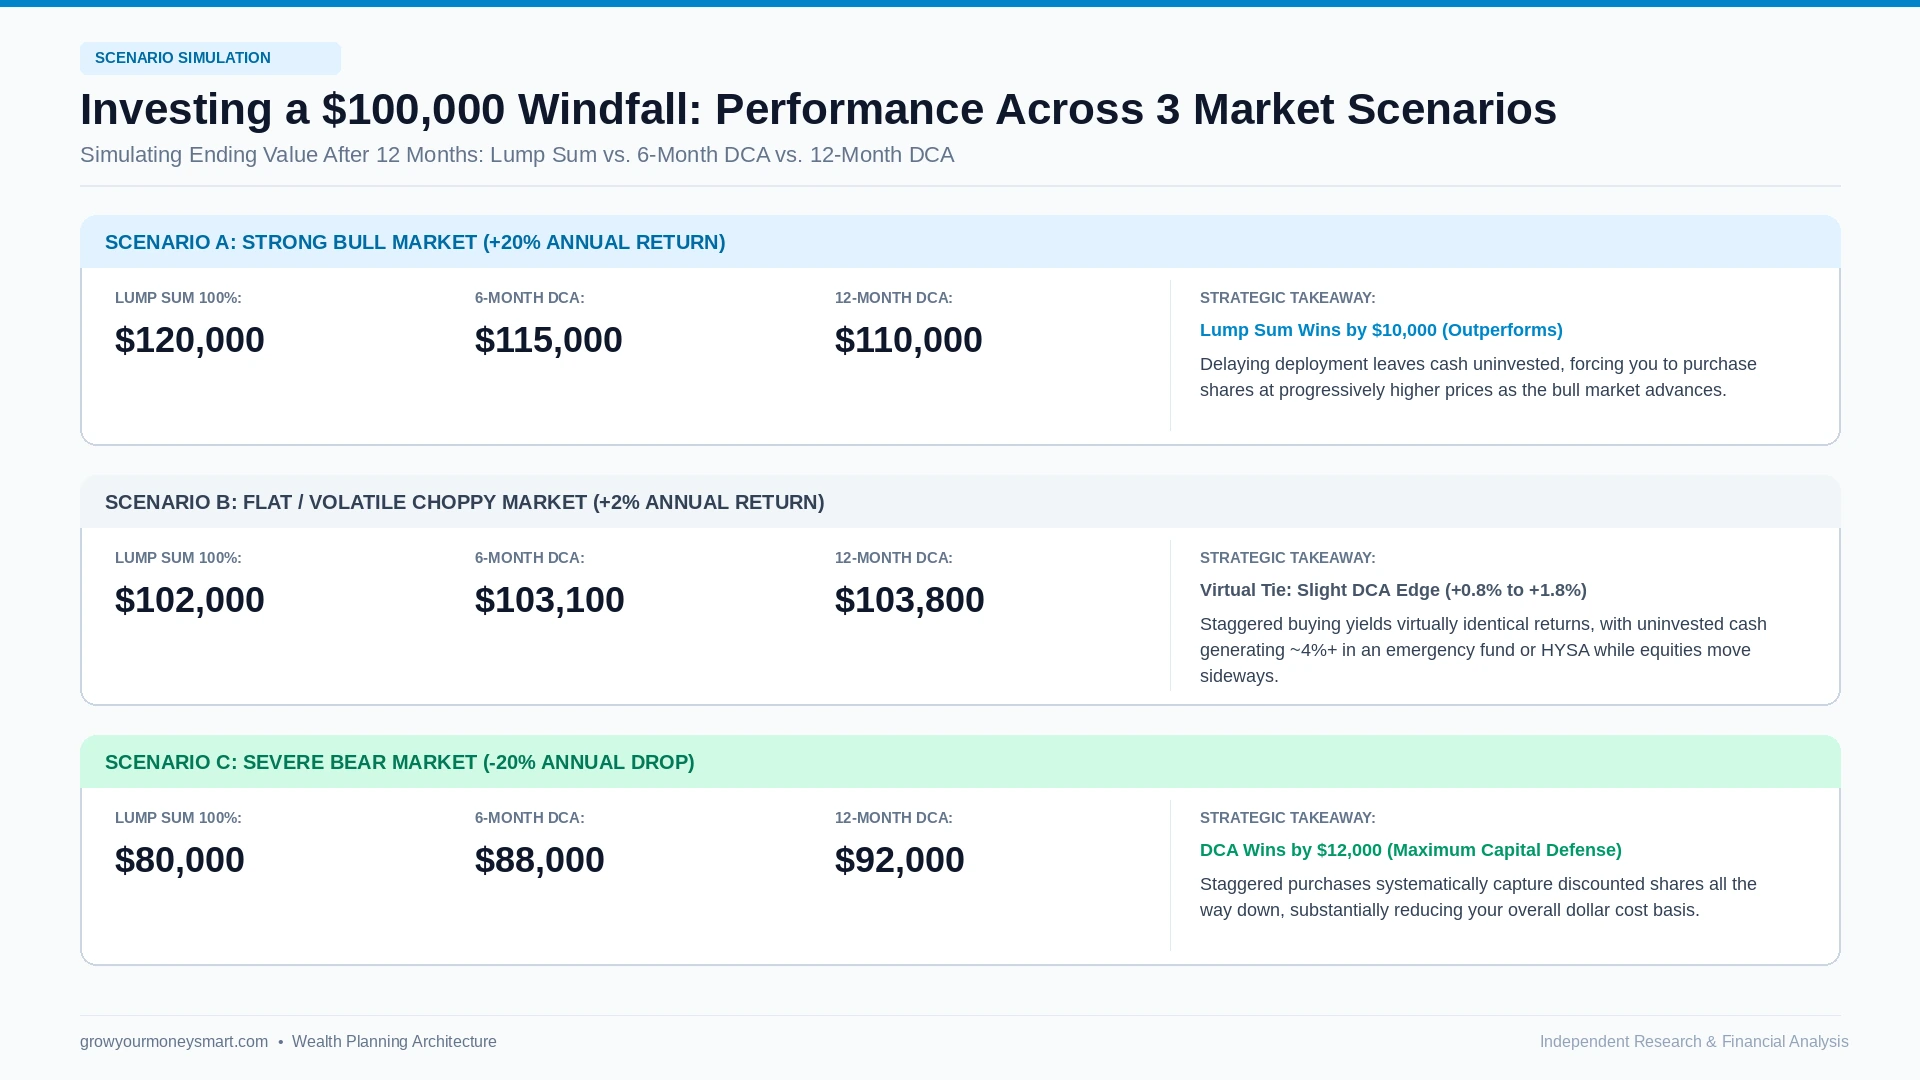
| Market Environment | Lump Sum (100% Day 1) | 6-Month DCA Schedule | 12-Month DCA Schedule |
|---|---|---|---|
| Bull Market (+20% Annual Gain) | $120,000 (WINNER) | $115,000 | $110,000 (-$10,000 drag) |
| Flat Market (+2% Annual Return) | $102,000 | $103,100 | $103,800 (Cash Yield Win) |
| Bear Market (-20% Annual Drop) | $80,000 (-$20,000 loss) | $88,000 | $92,000 (WINNER by $12k) |
The Modern Hybrid Solution: Combining High-Yield Cash with a 6-Month DCA
Historically, sitting in cash while dollar-cost averaging meant earning 0% interest in a brick-and-mortar bank account. Today, the macroeconomic environment offers an incredible financial buffer: High-Yield Savings Accounts (HYSAs) paying 4%+ annual percentage yield.
This reality enables a brilliant Hybrid Deployment Strategy:
- Day 1 Anchor Investment: Immediately invest 25% to 33% of the lump sum into your target portfolio (e.g., VOO or a 3-Fund Portfolio). This ensures you establish an immediate market foothold and never suffer complete “fear of missing out” if stocks rally.
- Park the Remainder in an HYSA: Move the remaining 67% to 75% into an FDIC-insured high-yield savings account or ultra-short government Treasury bill (see our Complete Emergency Fund & HYSA Guide and compare cash vs stocks in HYSA vs Stocks). Your uninvested capital earns safe, guaranteed monthly cash interest while awaiting deployment.
- Automate Equal Monthly Transfers: Divide the remaining balance into equal parts over the next 3 to 6 months (for instance, transferring $12,500 on the 1st of every month). Schedule this automatically inside your brokerage account so emotion and second-guessing are completely removed.
Windfall Size Decision Protocol: How to Deploy by Dollar Amount
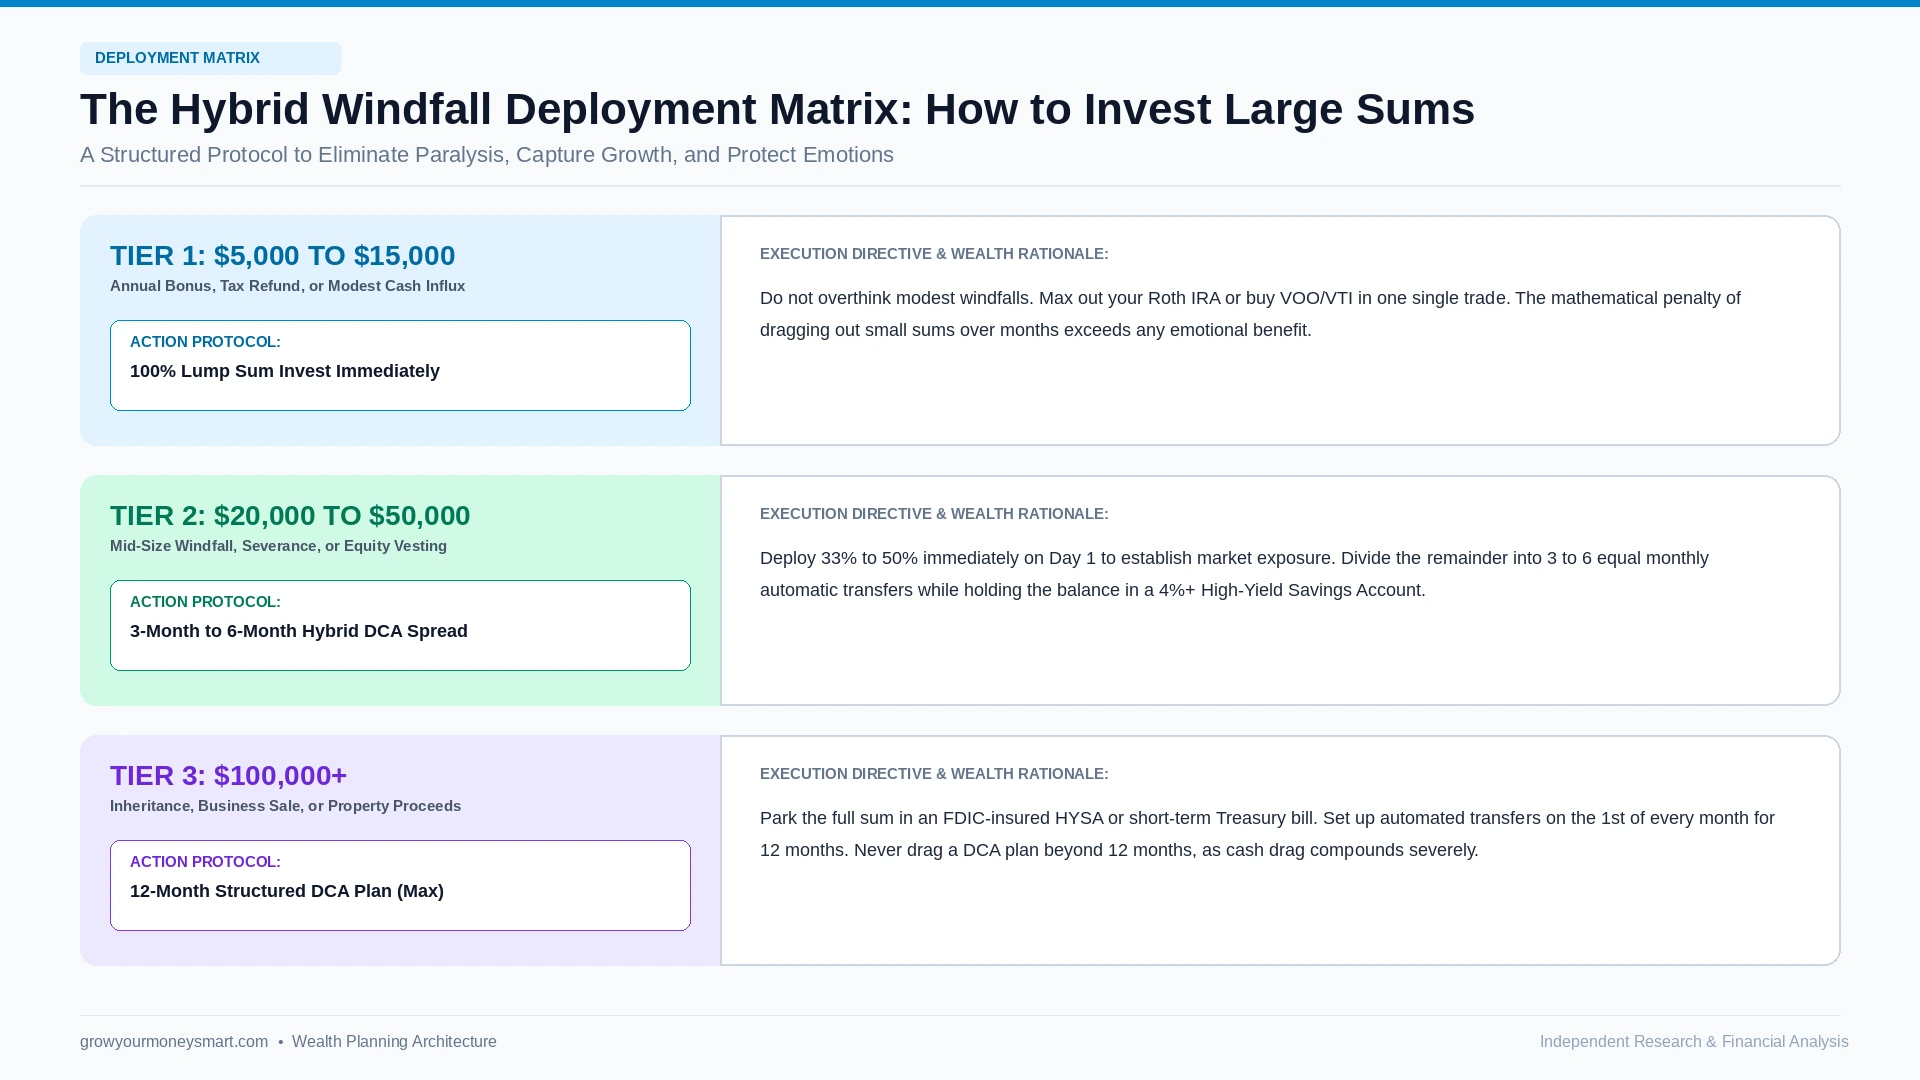
Use this practical rule-of-thumb framework based on the exact size of your windfall:
- $5,000 to $15,000 (Tax Refunds / Annual Bonuses): Action: 100% Lump Sum. Do not overcomplicate modest windfalls. The mathematical difference between DCA and lump sum on $10,000 is a few hundred dollars. Max out your Roth IRA or buy index funds in one single transaction and move on with your life.
- $20,000 to $50,000 (Mid-Size Windfall / Stock Options Vesting): Action: 3-Month Hybrid DCA. Invest one-third today, one-third next month, and the final third in Month 3. This brief 90-day window provides peace of mind without creating substantial cash drag.
- $100,000+ (Inheritances, Property Sales, Business Exits): Action: 6- to 12-Month Structured DCA. When dealing with sums that represent multiple years of income, emotional protection is paramount. Execute a disciplined 6- to 12-month automated schedule. Never extend DCA beyond 12 months—holding cash for two or three years exposes you to severe purchasing power erosion.
Frequently Asked Questions (FAQs)
Is dollar-cost averaging the same as regular 401(k) investing?
Yes and no. When you contribute a portion of your paycheck every two weeks into your 401(k), you are practicing dollar-cost averaging by default because that is when you receive cash. True “DCA vs Lump Sum” debate applies when you already have a large lump sum of cash sitting in front of you and must choose whether to invest it today or intentionally delay purchases over time.
Why does lump sum investing beat DCA mathematically?
Because stock markets rise approximately 73% of years due to continuous economic productivity, population expansion, and corporate profit compounding. When you delay investing, you are statistically betting against market growth. Cash drag costs an average of 1.5% to 2.3% per year compared to immediate market exposure.
What if the market is currently at an all-time high?
Historically, buying at all-time highs produces virtually the same 3- and 5-year forward returns as buying on any random day. Great companies continuously set new record highs over multi-decade expansions. In fact, research shows that over 30% of all market days occur within 2% of an all-time high.
How long should my DCA schedule last?
The optimal timeline is between 3 and 6 months (maximum 12 months for massive seven-figure windfalls). Extending a DCA plan over 24 or 36 months guarantees severe cash drag and inflation loss, transforming a risk-management tool into an excuse for market timing.
Should I DCA weekly, bi-weekly, or monthly?
Monthly or bi-weekly (matching your salary paycheck cycle) is ideal. Academic backtests show that investing daily or weekly yields virtually zero statistical advantage over monthly purchases, while creating massive unnecessary bookkeeping and tax-lot paperwork in taxable accounts.
What happens if the market crashes during my DCA plan?
You celebrate! A market crash during an active DCA plan is the best possible scenario. Your fixed monthly contribution buys significantly more shares at deep discounts, dramatically lowering your overall average cost basis and setting you up for massive rebound profits.
Can I start dollar-cost averaging with small amounts?
Yes. With zero-commission discount brokers offering fractional share investing, you can dollar-cost average with as little as $25 or $50 per paycheck. Read our complete beginner blueprint on how to start investing with $100 a month.
What is the final verdict: Which one should I choose?
If you have a steel stomach, an ultra-long time horizon, and zero emotional reaction to short-term pullbacks: choose Lump Sum for higher expected wealth. If you are anxious, afraid of market peaks, or investing an emotionally charged windfall: choose a 6-month DCA. The best strategy is whichever one prevents you from panic selling.

Jaiveer Hooda is a personal finance researcher and the founder of Grow Your Money Smart. With a background in computer engineering, he approaches money the way an engineer approaches any complex system — through data analysis, mathematical modeling, and ruthless optimization.
He built this platform on a single conviction: financial freedom is not a matter of luck. It is a system that can be designed, tested, and executed by anyone willing to follow the right blueprint. Every strategy published here is researched to the numbers, not written to the trend.
Expertise: Debt elimination · Retirement planning · Passive income · Budgeting systems
Connect: Pinterest | growyourmoneysmart.com | Contact Us