
The 70/20/10 rule allocates 70% of take-home pay to all living expenses (needs and wants combined), 20% to savings/debt, and 10% to giving or sinking funds. The 50/30/20 rule splits expenses into 50% needs and 30% wants. Use 70/20/10 in high-rent urban markets; use 50/30/20 for stricter discretionary control.
- The 70% Living Pool: Instead of fighting over what counts as a “need” vs “want,” the 70/20/10 rule gives you a single 70% living budget to cover shelter, food, and daily life.
- The 10% Giving / Buffer: A dedicated 10% allocation allows you to give charitably, tithe, or fund proactive sinking funds without hurting your savings.
- HCOL Compatibility: If rent absorbs 35%–45% of your income in expensive urban markets, 70/20/10 is far more realistic than forcing a 50% needs ceiling.
- Consistent 20% Wealth: Both frameworks preserve the critical 20% savings rule ($1,000/mo on a $5k salary), ensuring compound wealth remains protected.
- Zero-Based Transition: Pair either model with our Zero-Based Budgeting comparison to eliminate wasted cash flow.
While the 50/30/20 rule is widely hailed as the benchmark of personal finance, millions of Americans living in expensive rental markets find it frustratingly impractical. When rent alone consumes 38% of your net income, capping your total needs (including food, health insurance, electricity, and car payments) under 50% is mathematically impossible.
That is why the 70/20/10 budget rule has gained massive popularity in 2026. By collapsing needs and wants into a unified 70% living expenses envelope and carving out a purposeful 10% bucket for tithing, giving, or sinking funds, it provides a flexible alternative that actually works in the real world.
Whether you are managing a $3,000 budget, a $4,000 salary, or a $5,000 monthly income, this guide compares both frameworks head-to-head. You can also test your personal numbers directly with our interactive free budget calculator.
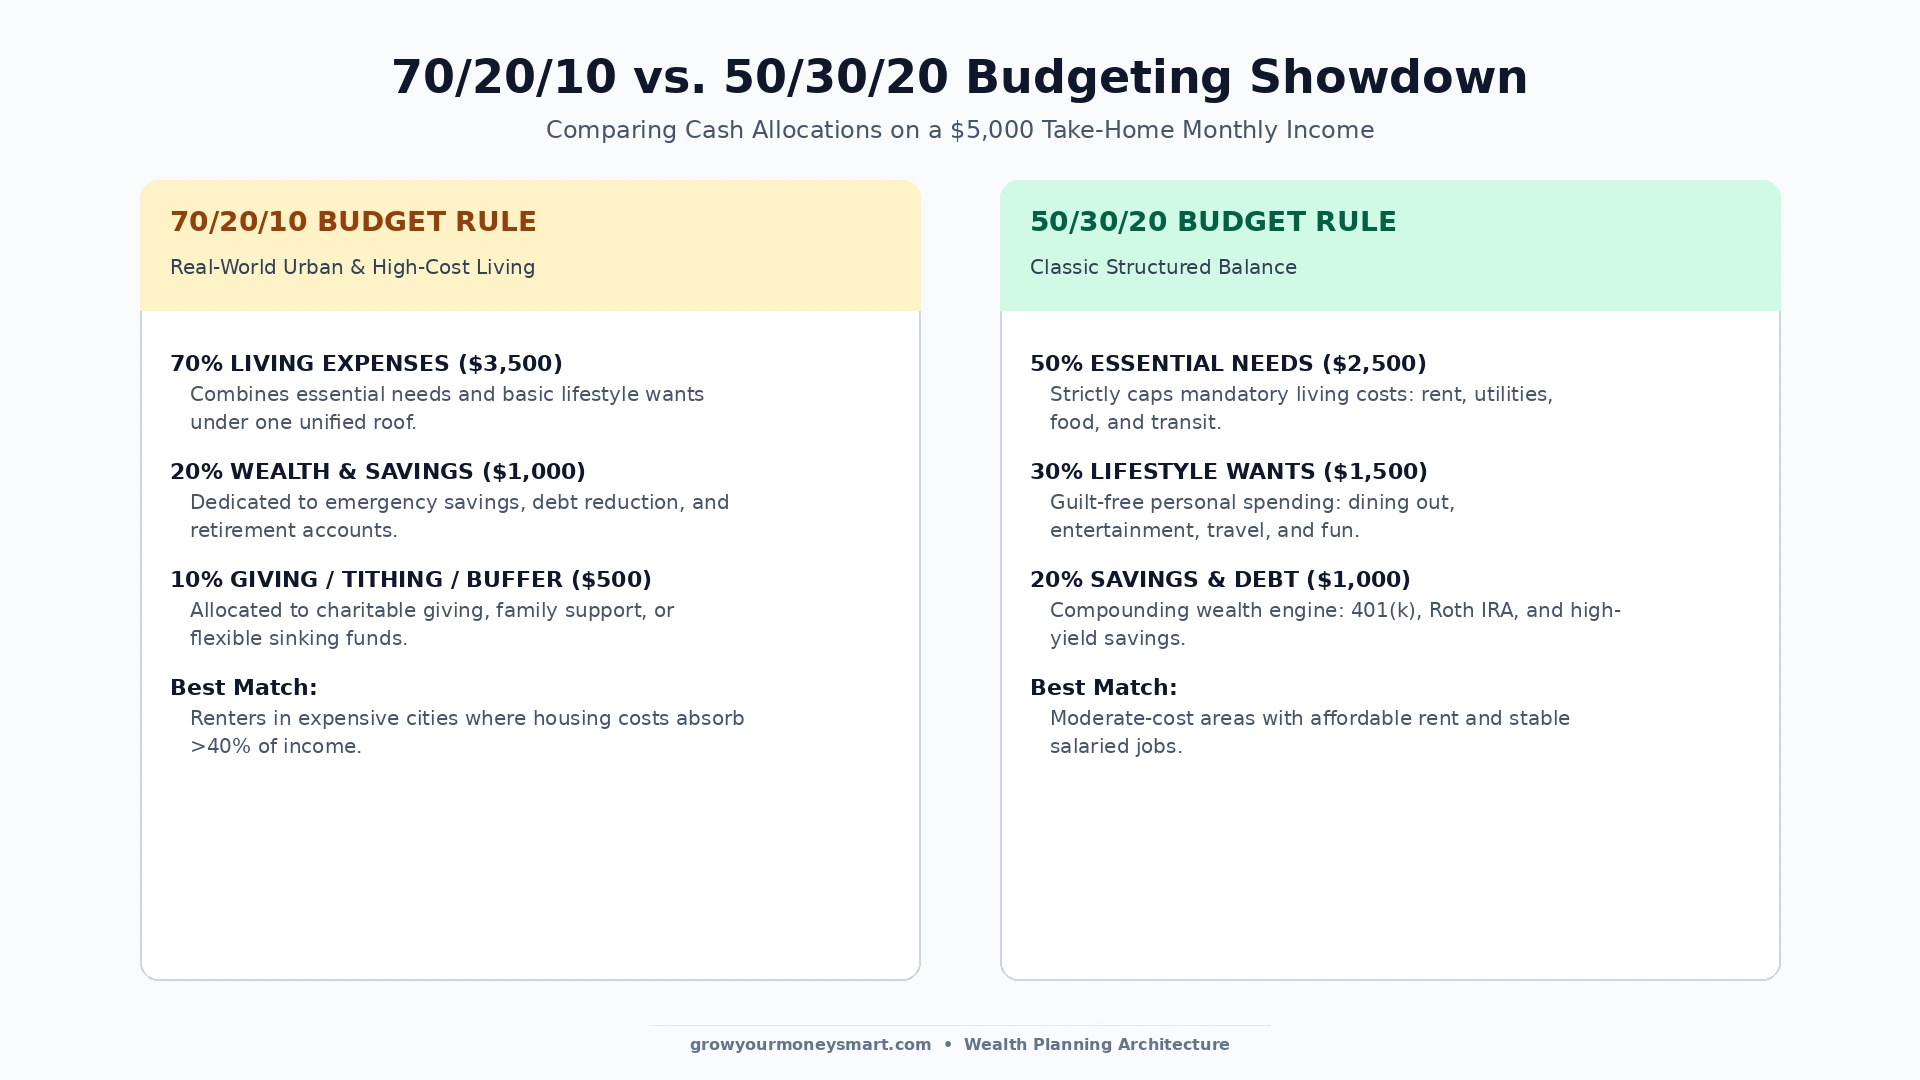
Dollar-for-Dollar Comparison: $5,000 Monthly Salary Case Study
Here is how a $5,000 net monthly salary divides across both systems:
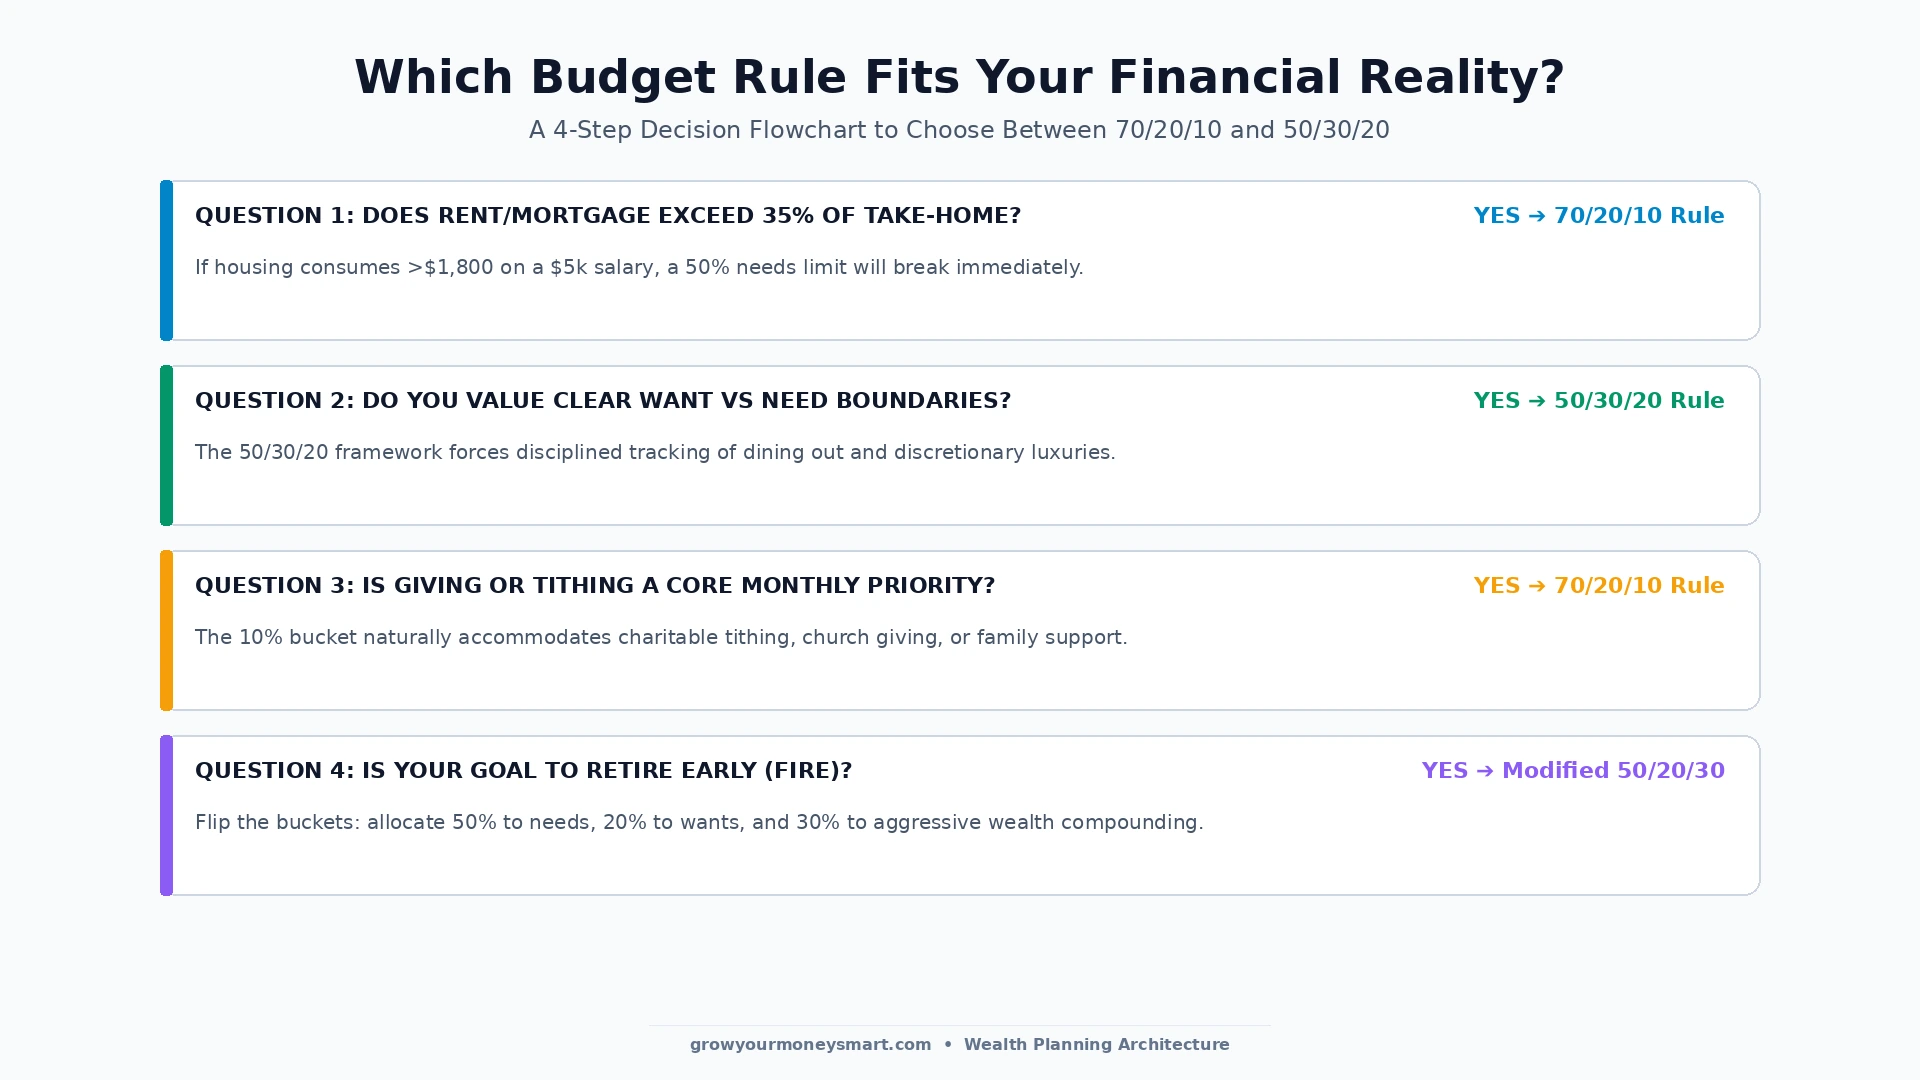
Decision Flowchart: Which Rule Should You Choose?
To pick the winning budgeting framework for your current life stage, follow this decision logic:
If you are actively paying off credit card debt or loans, review our step-by-step strategy on How to Prioritize Multiple Debts and calculate payoff schedules with our free debt payoff calculator.
Expert Video Breakdown: 70/20/10 vs 50/30/20 Head-to-Head
To compare real-world budget percentages across varying income brackets and see which rule fits your cost of living, watch Practical Personal Finance’s comparison:
Frequently Asked Questions (FAQs)
The 70/20/10 budget rule is a simple cash management framework where you allocate 70% of your take-home pay to all living expenses (needs and wants combined), 20% to savings and debt reduction, and 10% to giving, tithing, or personal sinking funds.
The 50/30/20 rule separates spending into two strict buckets: 50% needs and 30% wants. The 70/20/10 rule blends them into a single 70% living pool while introducing a dedicated 10% bucket for charitable giving, tithing, or miscellaneous goals.
The 70/20/10 rule is significantly better for HCOL areas because housing alone often absorbs 35% to 45% of income, making a 50% limit for all essential needs mathematically impossible.
Traditionally, the 10% bucket is used for charitable donations, church tithing, or community giving. If you do not give charitably, you can repurpose this 10% into dedicated sinking funds (like vacation or holiday savings) or add it to extra investing.
Yes. Minimum debt payments belong in your 70% living expense bucket, while extra accelerated debt payoff amounts come directly out of the 20% savings and debt reduction allocation.
On a $4,000 monthly take-home salary, the 70/20/10 rule allocates $2,800 to living expenses, $800 to savings and debt reduction, and $400 to giving or sinking funds.
The primary drawback is that combining needs and wants into one large 70% bucket makes it easier to overspend on discretionary luxuries while neglecting fundamental necessities if you do not track individual line items.
Yes. Many people use the 70/20/10 rule while paying off debt or living in high-rent apartments, and transition to the 50/30/20 rule (or an aggressive 50/20/30 FIRE split) as their income increases or living costs decrease.

Jaiveer Hooda is a personal finance researcher and the founder of Grow Your Money Smart. With a background in computer engineering, he approaches money the way an engineer approaches any complex system — through data analysis, mathematical modeling, and ruthless optimization.
He built this platform on a single conviction: financial freedom is not a matter of luck. It is a system that can be designed, tested, and executed by anyone willing to follow the right blueprint. Every strategy published here is researched to the numbers, not written to the trend.
Expertise: Debt elimination · Retirement planning · Passive income · Budgeting systems
Connect: Pinterest | growyourmoneysmart.com | Contact Us