
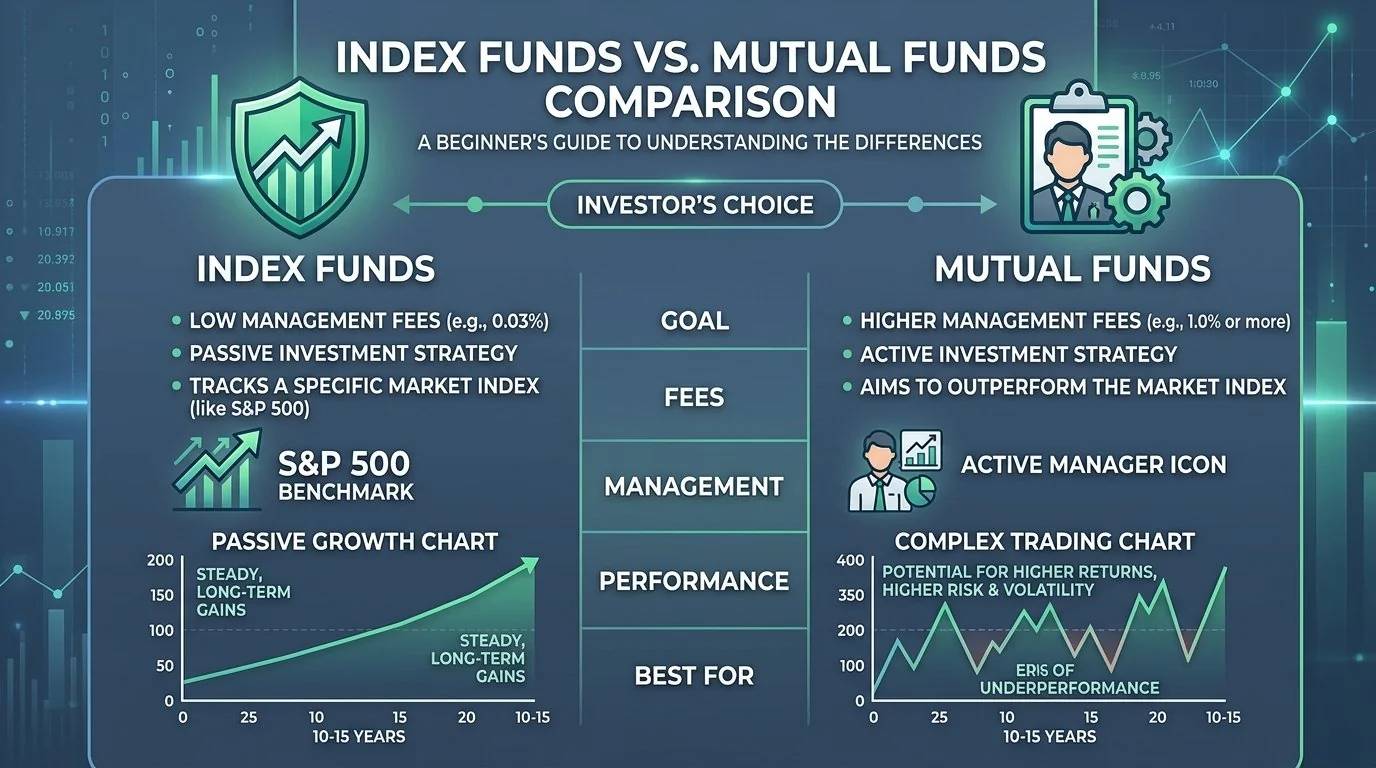
- Management Style: Index Funds are passively managed to mirror a benchmark index (e.g., S&P 500, Nifty 50). Active Mutual Funds rely on fund managers to pick stocks with the goal of beating the benchmark.
- Expense Ratio Impact: Index funds have ultra-low expense ratios (0.03% to 0.20%), whereas actively managed funds charge 0.75% to 2.25%, compounding to a massive cost difference over 20+ years.
- Performance Reality (SPIVA Data): Over a 10-to-15-year horizon, 85% to 90%+ of active fund managers fail to beat their benchmark index after factoring in management fees.
- Best Strategy for Most Investors: Low-cost, broad-market index funds provide the highest statistical probability of maximizing long-term net returns.
When you decide to start putting your hard-earned money to work, one of the most critical foundational choices you will face is deciding how your money should be invested. You will repeatedly encounter two main investment vehicles: Index Funds and Active Mutual Funds.
While both pool capital from thousands of investors to purchase a diversified basket of equities and fixed-income assets, their underlying management philosophies, fee structures, tax efficiencies, and compound returns are dramatically different.
Essential Prerequisite: Before committing capital to stock market volatility, ensure you have saved your first $1,000 emergency buffer and computed your complete 3 to 6-month safety net using our Free Emergency Fund Calculator. If you are balancing high-interest credit card balances, compare payoff priorities with our Debt-Free vs. Investing in 2026 Strategy Guide.
What is an Index Fund? (Passive Investing & Ultra-Low Fees)
An Index Fund is a mutual fund or Exchange-Traded Fund (ETF) built to mirror the exact composition and performance of a specific financial market benchmark, such as the S&P 500 (the 500 largest publicly traded American corporations) or the Total US Stock Market Index.
Pioneered by Vanguard founder John Bogle in 1976, index funds eliminate expensive research departments and high-frequency trading desks. Instead, automated computer algorithms purchase and weight shares matching the target index. Because overhead is near zero, fund sponsors pass these massive savings directly to you.
Core Characteristics of Index Funds:
- Management Style: 100% Passive (Algorithmic tracking of market indices).
- Average Expense Ratio: 0.02% – 0.08% (Just $2 to $8 per $10,000 invested annually).
- Trading Turnover: Ultra-low portfolio turnover, maximizing tax efficiency.
- Predictability: Captures 100% of market upside without risking fund manager underperformance.
What is an Active Mutual Fund? (Fund Managers & Alpha Seeking)
An Active Mutual Fund is an investment structure where professional portfolio managers, quantitative analysts, and research teams actively buy, sell, and time individual securities with the explicit goal of “beating the market” (generating positive Alpha).
Active managers pore over corporate balance sheets, conduct management interviews, and execute high-frequency sector rotations. However, funding this Wall Street infrastructure requires high ongoing management fees and marketing expenses (12b-1 fees) that are deducted directly from your account value every single day.
If you are weighing whether hiring a professional manager is worth the cost, read our comprehensive breakdown on DIY vs. Financial Advisor: Which Saves You More Money? to understand fee drag across different advisory models.
Core Characteristics of Active Mutual Funds:
- Management Style: 100% Active (Human forecasting, stock picking, and market timing).
- Average Expense Ratio: 0.75% – 1.50%+ ($75 to $150+ per $10,000 invested annually).
- Sales Loads: Many active broker funds charge front-end sales loads of 3%–5.75% just to enter the fund.
- Tax Drag: Frequent buying and selling triggers taxable capital gains distributions that pass to shareholders annually.
Head-to-Head Comparison Matrix
│
├── “I want maximum long-term wealth with lowest fees & zero manager risk.”
│ └── CHOICE: Index Funds / ETFs (Passively tracking S&P 500, Total Market, Nifty 50)
│ └── FEE ADVANTAGE: Expense Ratios < 0.15% | Long-Term Success Rate: Top 10-15%
│
└── “I want specialized sector exposure or believe in alpha generation in inefficient small-cap markets.”
└── CHOICE: Active Mutual Funds (Carefully screened for fund manager track record & low turnover)
└── CAVEAT: Must monitor rolling returns vs benchmark annually and account for 1.5%+ fee drag.
Here is a direct comparison across the critical dimensions that determine your net long-term returns:
| Evaluation Metric | Index Funds | Active Mutual Funds |
|---|---|---|
| Annual Expense Ratio | Ultra-Low (0.02% – 0.08%) | High (0.75% – 1.50%+) |
| 15-Year Performance | Outperforms ~90% of Active Funds | ~90% Underperform S&P 500 (SPIVA Data) |
| Sales Commissions (Loads) | None (100% No-load) | Often 2.5% – 5.75% upfront (Class A/C) |
| Tax Efficiency | Exceptional (Minimal internal churn) | Poor (Frequent taxable capital gains) |
| Manager Risk | Zero (Rules-based algorithm) | High (Manager departures & style drift) |
| Best Suited For | 99% of Retail & Beginner Investors | Niche/inefficient emerging debt markets |
The 1% Fee Trap: How Expense Ratios Eat 30% of Your Wealth
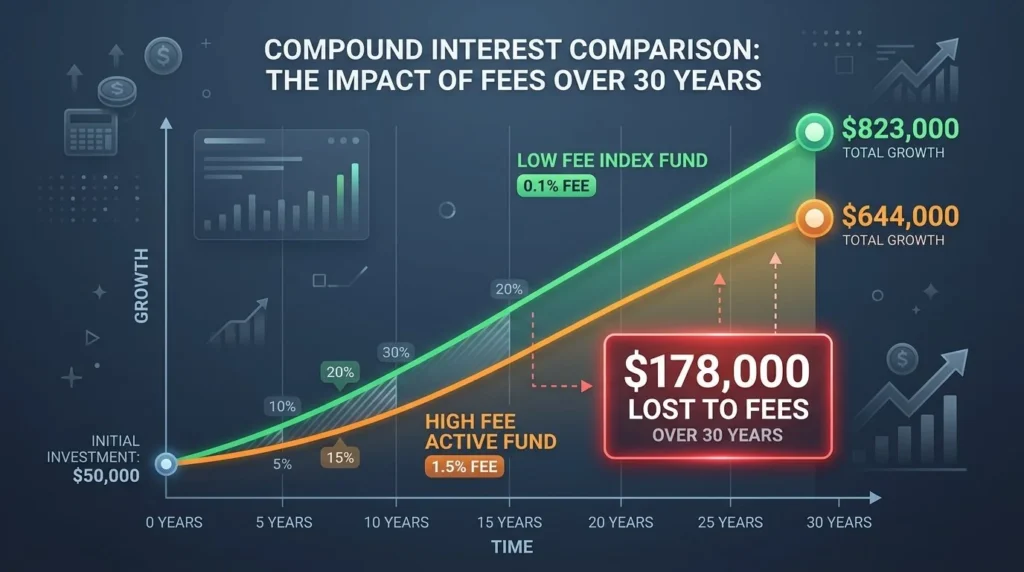
Most novice investors assume a 1% annual fee is trivial. But because investment returns compound exponentially, fees compound in reverse with devastating efficiency. You pay the expense ratio every single year regardless of market gains or losses.
Real-World 30-Year Compounding Simulation
Assume an initial investment of $10,000 with ongoing monthly contributions of $500 at an average 8% annual market return:
| Timeline | Index Fund (0.03% Fee) | Active Mutual Fund (1.00% Fee) | Wealth Lost to Fees |
|---|---|---|---|
| After 10 Years | $109,240 | $101,890 | −$7,350 |
| After 20 Years | $338,420 | $287,140 | −$51,280 |
| After 30 Years | $823,150 | $644,380 | −$178,770 (Over 21% of Portfolio!) |
That single percentage point confiscated nearly $180,000 of your retirement net worth to fund Wall Street bonuses.
To calculate how much monthly cash flow you can realistically allocate toward long-term index investing without stretching your household budget, use our Free 50/30/20 Budget Calculator or follow our step-by-step $3,000 Monthly Income Budgeting Blueprint.
Deciding between guaranteed cash yields and market equities? Before deploying long-term capital, review our HYSA vs stock market long-term returns math to see the exact breakeven horizon where stock compounding overtakes cash preservation.
Watch: Index Funds vs. ETFs vs. Mutual Funds Explained Simply
For a visual, high-yield walkthrough of how index funds, ETFs, and mutual funds work in practice, watch this breakdown by Humphrey Yang:
Step-by-Step: How to Buy Your First Low-Cost Index Fund
Getting started with index funds takes under 15 minutes. Follow this 4-step execution blueprint:
- Choose a Top-Tier Zero-Commission Brokerage: Open an account with Vanguard, Fidelity, or Charles Schwab.
- Select Your Account Wrapper:
- Tax-Advantaged (Retirement): Open a Roth IRA first for 100% tax-free growth and tax-free retirement withdrawals. (Read our guide on The Unbeatable Advantage of Early Retirement Saving).
- Taxable Brokerage: For general wealth building with no annual contribution caps or withdrawal restrictions.
- Pick Your Core Benchmark Index Fund:
- S&P 500 Index: Vanguard S&P 500 ETF (
VOO) / VFIAX, Fidelity 500 Index (FXAIX), or Schwab S&P 500 (SWPPX). - Total US Stock Market: Vanguard Total Stock Market (
VTI/ VTSAX) or Fidelity Total Market (FSKAX). - Total International Stock: Vanguard Total International (
VXUS/ VTIAX).
- S&P 500 Index: Vanguard S&P 500 ETF (
- Automate Your Contributions: Set up an automatic transfer on payday (e.g., $100, $250, or $500/month) to utilize Dollar-Cost Averaging (DCA). You will automatically buy more shares when markets dip and fewer shares when prices peak without ever needing to time the market.
Before locking in your portfolio ratios, review our foundational Investment Time Horizon Strategy Guide and study the 5 Stages of Retirement Planning to ensure your stock-to-bond asset allocation matches your specific age, risk tolerance, and retirement timeline.
⚡ Low-Cost Investing & Portfolio Automation Blueprints
Expand your low-cost investing strategy with these hands-off portfolio approaches:
- Automated Portfolio Management: Explore our guide on Robo-advisors vs target date funds comparison to evaluate whether automated rebalancing beats static target-date allocations.
- Starting Small in Index Funds: Explore our guide on how to start investing with $100 a month through fractional shares and broad-market total index ETFs.
Frequently Asked Questions (FAQ)
Clear, direct answers to the most common search questions comparing index funds with active mutual funds:
Index funds eliminate fund manager risk and stock-picking failure. While they carry broader stock market volatility, they are safer from persistent manager underperformance and excessive management fee drag compared to active mutual funds.
Yes, index funds fluctuate with market cycles and can lose value during short-term economic downturns. However, broad market indexes have historically recovered and yielded positive compounded growth over 10+ year time horizons.
Index funds outperform primarily due to ultra-low expense ratios (often 0.05% vs 1.5%+) and low portfolio turnover. Over 10 to 15 years, SPIVA reports show that 85% to 90%+ of active fund managers fail to beat their benchmark after fees.
Yes. An index fund is a type of mutual fund (or exchange-traded fund) that follows a passive, rules-based indexing strategy rather than active manager stock selection.
A beginner can comfortably allocate 70% to 100% of their equity allocation into broad-market index funds using regular dollar-cost averaging or monthly SIP investments.
Mutual funds and exchange-traded funds are regulated under the Investment Company Act of 1940, requiring clear fee disclosure in annual prospectuses. Consult the official U.S. Securities and Exchange Commission (SEC) Mutual Funds and ETFs Guide for statutory guidelines and consumer protections.
🏛️ Portfolio Construction & Passive Wealth Blueprints
Deepen your investment strategy with institutional-grade portfolio construction and timing analyses:
- S&P 500 Blueprint: how to invest in the S&P 500 beginner guide — core allocation strategies for the world’s most resilient index.
- ETF Tax Efficiency: ETFs vs index funds beginner guide — explore the in-kind creation/redemption mechanism that prevents capital gains taxes.
- Global 3-Fund Blueprint: the ultimate 3-fund portfolio lazy investor guide — balance total US market, total international, and total bond market.
- Contribution Timing: dollar-cost averaging vs lump sum investing — mathematical analysis of market timing vs time in the market.
- Passive Cash Flow: dividend investing for beginners: build passive cash flow — evaluating dividend reinvestment strategies vs market-cap indexing.

Jaiveer Hooda is the Lead Financial Researcher & Personal Finance Analyst at Grow Your Money Smart. Specializing in personal wealth optimization, index fund compounding, high-yield savings mechanics, and consumer debt elimination strategies. With a background in computer engineering, he applies mathematical modeling, cashflow simulations, and empirical risk analysis to evaluate personal finance vehicles and credit products. Every analysis is backed by verified regulatory disclosures, IRS tax schedules, and empirical APY compounding math.
Areas of Expertise: Personal Finance · High-Yield Savings Accounts (HYSA) · Index Funds & S&P 500 Compounding · Retirement Planning (401k/IRA) · Debt Optimization · Credit Card APR Mechanics.
Transparency & Editorial Policy: Editorial Standards | Report a Correction