
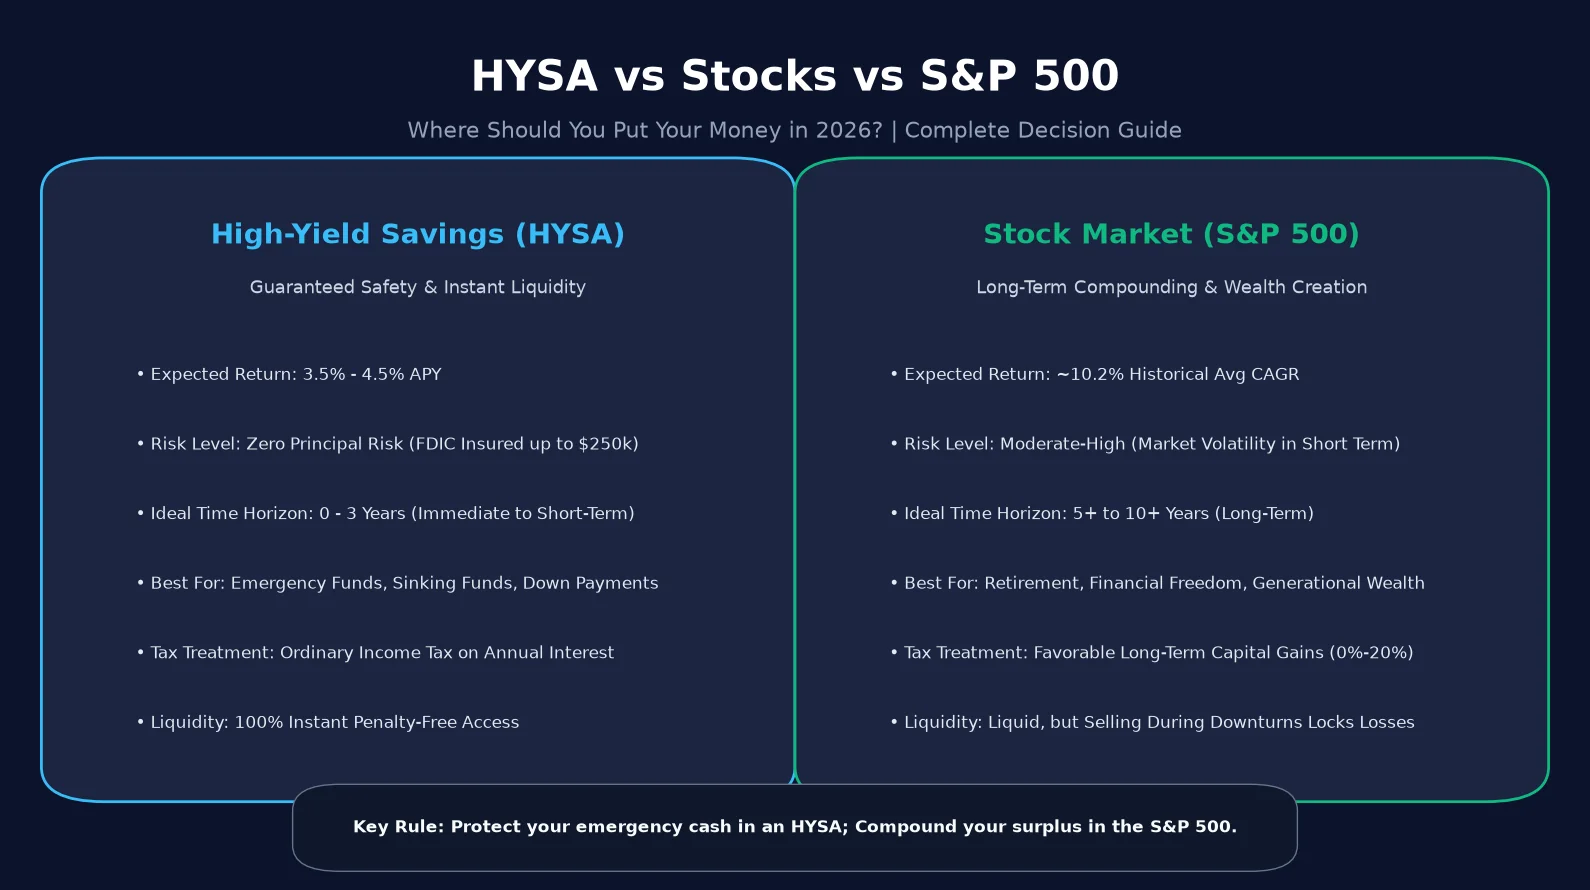
- Core Difference: A High-Yield Savings Account (HYSA) provides guaranteed capital preservation with zero market risk (yielding ~4.0%–5.0% APY), whereas stocks and the S&P 500 deliver exponential long-term compounding (~10.2% historical average CAGR) with short-term price volatility.
- The 3-Year Time Horizon Rule: Money you will need in under 3 years (emergency funds, car purchase, house down payment) belongs 100% in an HYSA. Money you don’t need for 5+ to 10+ years belongs in diversified broad-market index funds.
- Tax Drag Warning: HYSA interest is taxed annually as ordinary income (up to 37%+ federal bracket). In contrast, stock investments held over 1 year receive favorable long-term capital gains tax rates (0%, 15%, or 20%) with tax deferral until sold.
- The Opportunity Cost of Cash: Over a 30-year timeframe, investing $500/month in the S&P 500 produces over $1,080,000, compared to just $387,000 in a 4.5% HYSA—a massive $693,000+ wealth gap.
- Optimal Strategy: Never treat HYSA and stocks as an "either/or" choice. Keep 3–6 months of essential living expenses in an HYSA as your financial defense, then automate 100% of your remaining surplus into S&P 500 index funds as your financial offense.
The Great Dilemma: HYSA vs Stocks vs S&P 500 in 2026
If you have cash sitting in a traditional checking or savings account earning a microscopic 0.01% interest, you are effectively watching inflation eat away at your hard-earned purchasing power every single month. In 2026, savers and investors are presented with two primary wealth vehicles: High-Yield Savings Accounts (HYSA) paying between 4.0% and 5.0% APY, and Stock Market Equities (led by the S&P 500 index) delivering long-term historical returns of roughly 10% annually.
In the debate of HYSA or stocks (and index fund vs HYSA), allocation comes down to timeline: for financial goals under 3 to 5 years, a 5.0% High-Yield Savings Account (HYSA) is mathematically superior because it guarantees 100% FDIC capital preservation with zero market drawdown risk. For wealth horizons exceeding 7 to 10 years, investing in the S&P 500 historically delivers 10.2% annualized nominal returns, crushing inflation and delivering 3.4x more wealth over 30 years despite short-term market volatility.
To build a long-term compounding portfolio, read our step-by-step how to invest in S&P 500 beginner’s guide, and structure your savings runway with our investment time horizon framework.
However, choosing between HYSA vs stocks is not a binary gamble. It is a calculated asset allocation exercise rooted in your personal investment time horizon, risk tolerance, and cash flow liquidity needs. Parking your emergency reserves in the stock market can trigger catastrophic financial distress if a bear market coincides with an unexpected layoff. Conversely, keeping all your wealth in cash or an HYSA creates massive cash drag, permanently handicapping your ability to build generational wealth and achieve early retirement.
In this comprehensive master guide, we break down the mathematical compounding differences, risk-versus-return profiles, tax implications, and a practical 4-step capital allocation framework so you know exactly where to put every dollar of your money in 2026.
Head-to-Head Comparison Matrix: HYSA vs Stocks vs S&P 500
To understand the strategic trade-offs between cash preservation and equity growth, examine the direct structural comparison below:
| Core Dimension | High-Yield Savings Account (HYSA) | Individual Stocks (Equities) | S&P 500 Index Funds (VOO / SPY) |
|---|---|---|---|
| Primary Objective | Capital Preservation & Immediate Liquidity | Maximum Capital Growth / Alpha | Broad Market Wealth Compounding |
| Expected Annual Return | 3.5% – 5.0% APY (Variable) | -100% to +100%+ (High Variance) | ~10.2% Historical Avg CAGR |
| Principal Risk Level | Zero Risk (FDIC Insured up to $250k) | High (Company Default / Volatility) | Moderate (Market Drawdowns) |
| Ideal Time Horizon | Under 3 Years (0 to 36 Months) | 5+ to 10+ Years | 5+ to 30+ Years |
| Liquidity & Access | Instant (1–2 business days transfer) | T+1 settlement (Risk of selling at loss) | T+1 settlement (Liquid market) |
| Tax Treatment | Ordinary Income Tax (Paid Annually) | Capital Gains (0%–20%) + Qualified Divs | Capital Gains (0%–20%) + Tax Deferral |
| Inflation Protection | Low (Barely matches or lags inflation) | High (Select pricing power companies) | Superior (Historical 7% real return) |
| Effort / Skill Required | Zero (Set and forget) | High (Fundamental & technical analysis) | Zero (Passive automated investing) |
As the comparison demonstrates, comparing stocks vs hysa is about balancing certainty of principal against growth of purchasing power. Let’s delve into how each vehicle functions under the hood.
Understanding High-Yield Savings Accounts (HYSA)
A High-Yield Savings Account is a federally insured deposit account offered predominantly by digital online banks (such as Ally, Marcus by Goldman Sachs, Discover, Capital One, and SoFi). Because online banks do not bear the overhead costs of maintaining thousands of brick-and-mortar branch locations, they pass those savings on to consumers in the form of interest rates that are 10x to 25x higher than traditional commercial banks.
Advantages of an HYSA in 2026
- FDIC / NCUA Insurance Protection: Deposits are backed by the full faith and credit of the United States Government up to $250,000 per depositor, per insured institution. Even if the banking institution collapses, your principal balance is 100% guaranteed.
- Guaranteed Positive Nominal Yield: Your balance increases predictably every day and compounds monthly. There are zero market dips, bear markets, or red portfolio days.
- Priceless Psychological Peace of Mind: Knowing that your essential living expenses and emergency cash are liquid and shielded from stock market crashes prevents panic-selling during macroeconomic downturns.
- Frictionless Accessibility: You can transfer funds to your primary checking account within 24 to 48 hours without paying early withdrawal penalties.
Disadvantages & Hidden Pitfalls of HYSAs
- Variable Interest Rates (The Rate-Cut Risk): HYSA yields are pegged directly to the Federal Reserve’s Federal Funds Rate. When central banks cut interest rates to stimulate the economy, online banks immediately lower HYSA APYs. An account yielding 5.0% today could drop to 3.0% or 2.5% over the next 12 to 24 months.
- Inflation Erosion (Negative Real Yields): If inflation averages 3.2% and your HYSA earns 4.2%, your net pre-tax real gain is only 1.0%. After subtracting federal and state taxes, your purchasing power may actually stagnate or decline.
- Severe Long-Term Opportunity Cost: Stashing money in an HYSA for 10+ years guarantees that you forfeit the exponential compounding power of the broader global economy.
To accurately compute how much emergency cash you need to maintain in your account, explore our interactive Emergency Fund Calculator to establish your customized 3-to-6-month baseline safety floor.
Understanding the Stock Market & S&P 500 Index Funds
Investing in the stock market means purchasing fractional ownership in publicly traded corporations. When you invest in a broad-market index fund like the S&P 500 (via exchange-traded funds such as Vanguard S&P 500 ETF VOO or SPDR SPY), you instantly acquire a stake in the 500 largest, most profitable, and most innovative American corporations across technology, healthcare, finance, consumer goods, and industrials.
Why the S&P 500 Dominates Long-Term Wealth Creation
- Historical Compounding Track Record: Over the past 90+ years, the S&P 500 has generated an average annualized nominal return of approximately 10.2% CAGR (~7.1% after adjusting for historical inflation). Over a 20-to-30-year horizon, this compound growth rate turns modest monthly contributions into multi-million dollar portfolios.
- Self-Cleansing Corporate Index Architecture: The S&P 500 automatically rebalances. Stagnant or failing companies drop out of the index, while hyper-growth innovators (such as leaders in cloud computing, semiconductors, and artificial intelligence) expand in weighting.
- True Inflation Hedge: Profitable companies possess pricing power. When inflation drives up the cost of raw materials, businesses raise prices on end consumers, thereby expanding revenues and protecting shareholder returns.
- Tax-Efficient Compounding: You pay zero capital gains tax while your index fund shares appreciate inside your account. Taxes are only triggered when you voluntarily sell shares in a taxable brokerage, or deferred indefinitely within tax-advantaged accounts like a Roth IRA or 401(k).
For a detailed breakdown of index investing versus active fund management, read our complete guide on Index Funds vs Mutual Funds: Complete Guide.
Mathematical Simulation: $10,000 Initial + $500/Month Compounding Over 30 Years
To witness the profound difference between cash savings and equity investing, let’s run a rigorous mathematical simulation comparing an initial principal of $10,000 accompanied by ongoing contributions of $500 per month ($6,000 annually) across three distinct vehicles over 1, 5, 10, 20, and 30-year milestones:
| Time Horizon | Total Out-of-Pocket Cash Deposited | Traditional Savings Account (0.01% APY) | High-Yield Savings Account (4.5% APY) | S&P 500 Index Fund (~10.2% Avg CAGR) | Wealth Advantage of S&P 500 vs HYSA |
|---|---|---|---|---|---|
| Year 1 | $16,000 | $16,001 | $16,585 | $17,320 | +$735 |
| Year 3 | $28,000 | $28,004 | $30,684 | $34,812 | +$4,128 |
| Year 5 | $40,000 | $40,010 | $46,580 | $57,694 | +$11,114 |
| Year 10 | $70,000 | $70,035 | $94,452 | $149,150 | +$54,698 |
| Year 15 | $100,000 | $100,075 | $154,236 | $297,420 | +$143,184 |
| Year 20 | $130,000 | $130,130 | $228,895 | $538,015 | +$309,120 |
| Year 25 | $160,000 | $160,200 | $322,140 | $928,340 | +$606,200 |
| Year 30 | $190,000 | $190,285 | $387,412 | $1,080,850 | +$693,438 |
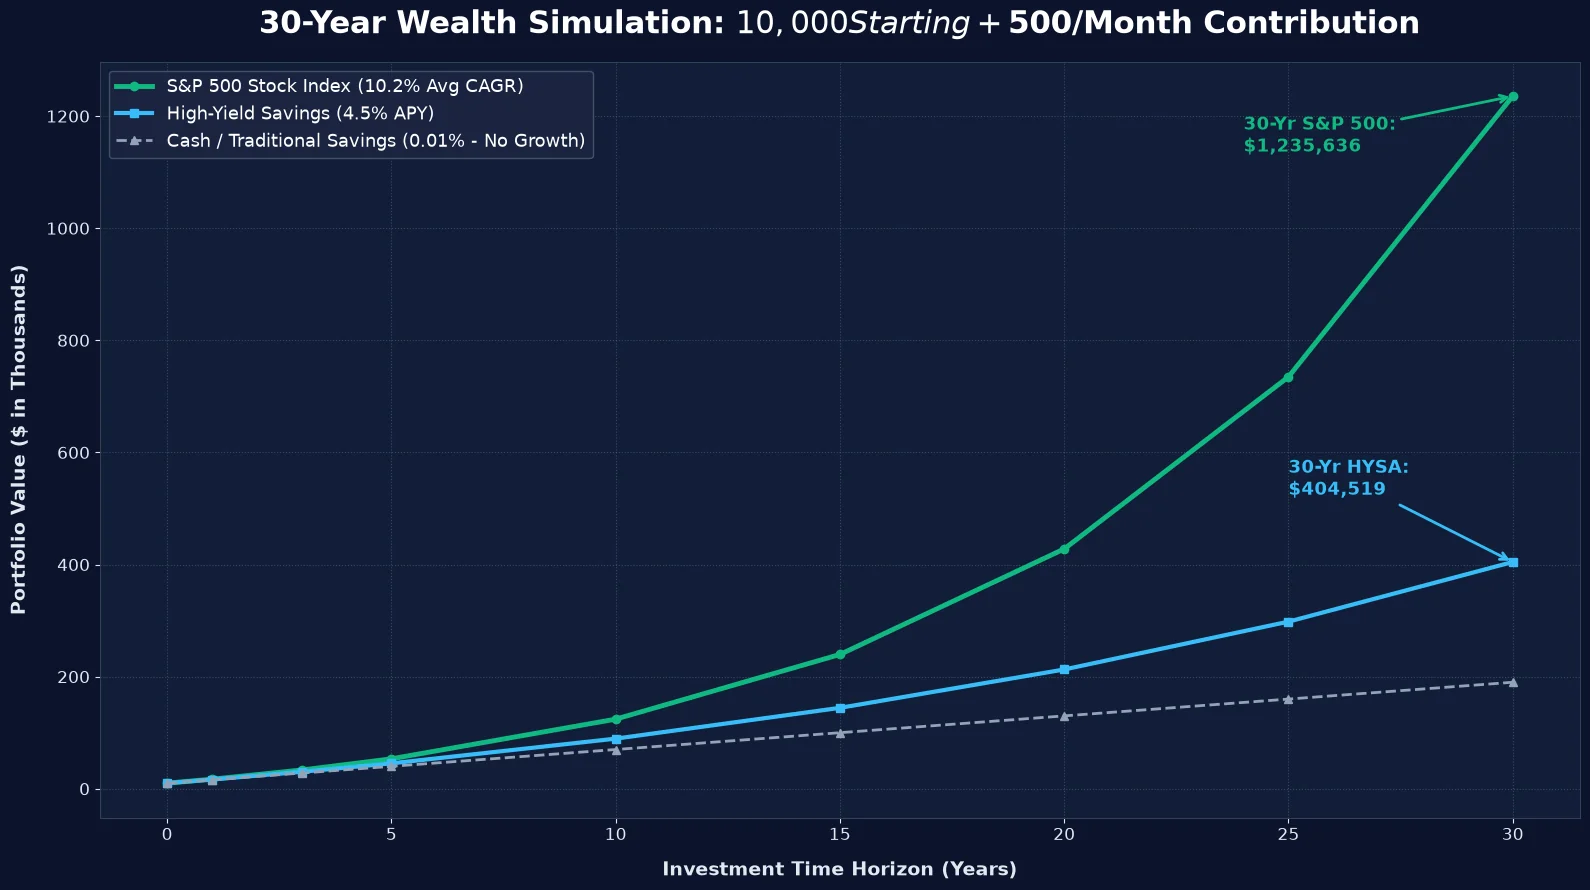
The numbers reveal an unmistakable truth: over short horizons (Years 1 to 3), the monetary difference between an HYSA and stocks is modest ($735 to $4,128), making the safety and liquidity of an HYSA well worth the trade-off. But as the time horizon extends beyond 10, 20, and 30 years, compound interest in the S&P 500 expands exponentially, creating an overwhelming wealth gap of nearly $700,000 on the exact same monthly contribution.
Mathematical Simulation: The True Cost of Playing It Too Safe
To understand the true divergence between cash savings and stock market investing, let’s examine the mathematical reality of compound interest over time. Suppose you start with a $10,000 initial balance and contribute $500 per month into both options:
- Option A (HYSA): Compounding at a consistent 4.5% APY.
- Option B (Stock Market / S&P 500): Compounding at a historical average of 10.0% annual return.
| Timeframe | Total Contributed | HYSA Balance (4.5% APY) | Stock Market (10.0% Return) | The Wealth Gap |
|---|---|---|---|---|
| 5 Years | $40,000 | $46,558 | $54,849 | +$8,291 |
| 10 Years | $70,000 | $92,624 | $129,566 | +$36,942 |
| 20 Years | $130,000 | $223,380 | $458,574 | +$235,194 |
| 30 Years | $190,000 | $430,303 | $1,330,119 | +$899,816 |
As demonstrated in the simulation above, while both accounts start relatively close in Year 5 ($46k vs $54k), the compounding curve of equity returns goes exponential over 20 and 30 years. Over three decades, keeping long-term money solely in an HYSA results in a wealth gap of nearly $900,000 on identical cash contributions.
The 2026 Cash Allocation Decision Matrix: Where Should You Put Your Money?
Rather than viewing the decision as an all-or-nothing contest, veteran financial planners utilize the 3-Tier Money Hierarchy to strategically allocate capital based on timeline, liquidity necessity, and risk tolerance:
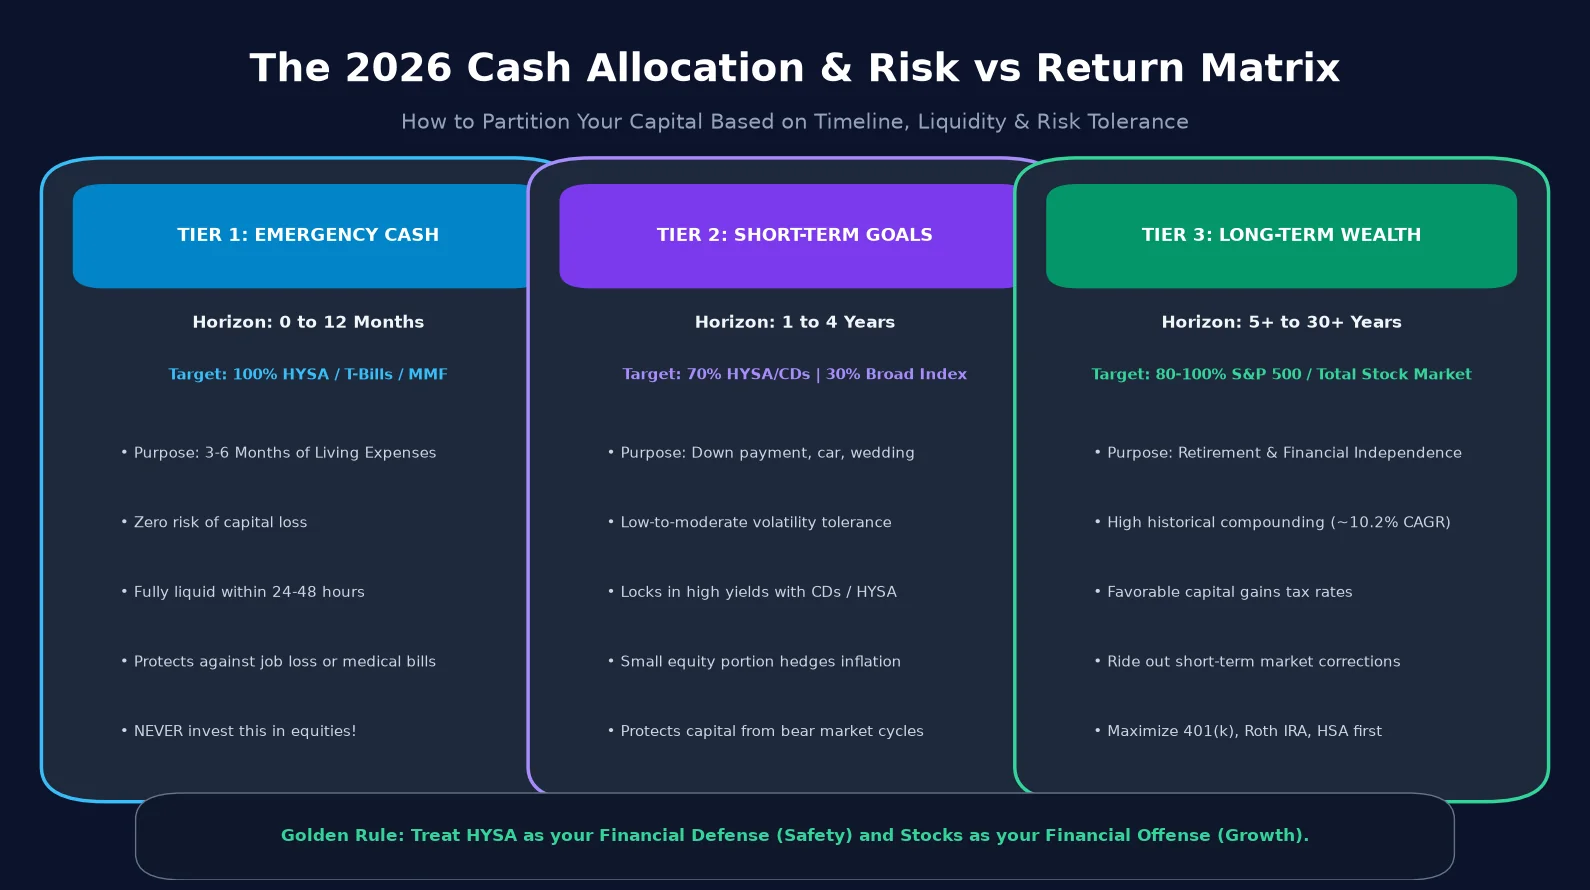
Tier 1: Emergency Cash Buffer (Timeline: 0 to 12 Months)
- Target Allocation: 100% High-Yield Savings Account (HYSA) or Treasury Bills.
- Fund Size: Exactly 3 to 6 months of essential baseline living expenses (housing, utilities, food, medical, debt minimums).
- Golden Rule: Never invest this money in stocks. If the stock market drops 25% during a recession and you simultaneously lose your job, you would be forced to liquidate equities at a devastating loss to pay rent.
Tier 2: Short-Term & Mid-Term Sinking Funds (Timeline: 1 to 4 Years)
- Target Allocation: 70% HYSA / Fixed-Term CDs + 30% Conservative Index Funds / Bonds.
- Purpose: Money allocated for a home down payment, upcoming wedding, vehicle replacement, or tuition.
- Strategic Rationale: A 1 to 4-year horizon does not provide sufficient runway to recover from a major stock market correction. Locking in fixed yields in an HYSA or Certificate of Deposit guarantees that your capital is intact on the day you need to write the check.
Tier 3: Long-Term Compounding & Wealth (Timeline: 5+ to 30+ Years)
- Target Allocation: 80%–100% Broad-Market Equities (S&P 500 / Total US Stock Market / International Index).
- Purpose: Financial independence, retirement nest egg, generational wealth.
- Strategic Rationale: Over rolling 20-year periods in US stock market history, the S&P 500 has never produced a negative return. Time in the market eliminates volatility risk and allows compound interest to perform its heavy lifting.
To master time horizons and risk capacity, explore our in-depth analysis on Investment Time Horizon: The Definitive Asset Allocation Blueprint.
HYSA or Stocks: The 3-Step Decision Flowchart for 2026
If you’re still torn between an HYSA or stocks, or deciding between an index fund vs HYSA, apply this practical 3-step triage:
If NO → Direct 100% of your savings into an HYSA. You cannot afford stock market volatility without an emergency defensive buffer.
If YES → Pay off high-interest debt before allocating surplus into stocks or retaining excess cash in an HYSA. A guaranteed 20%+ return beats both.
If YES → Choose a broad-market index fund (S&P 500) over an HYSA. Over rolling 10-year horizons, the S&P 500 has historically outpaced cash yields in 94% of market periods.
Critical Tax Implications: HYSA Interest vs Stock Market Capital Gains
One of the most overlooked factors when comparing stocks vs hysa is the massive tax discrepancy between interest income and capital growth:
| Tax Attribute | High-Yield Savings Account (HYSA) | Stock Market (Taxable Brokerage) | Retirement Accounts (Roth IRA / 401k) |
|---|---|---|---|
| Tax Classification | Ordinary Income Tax (Form 1099-INT) | Long-Term Capital Gains & Qualified Divs | Tax-Deferred or 100% Tax-Free Growth |
| Tax Rate | 10% to 37%+ (Your highest federal bracket) | 0%, 15%, or 20% (Substantially lower) | 0% on qualified Roth withdrawals |
| Tax Timing | Taxed annually in the year earned | Taxed ONLY when shares are sold | Taxed at withdrawal (Traditional) or Never (Roth) |
| State & Local Taxes | Fully subject to state & local income tax | Subject to state capital gains taxes | Varies by account type and state law |
For example, if you earn $4,000 in HYSA interest and sit in the 24% federal tax bracket plus a 5% state tax bracket, you will owe $1,160 in taxes at the end of the year, reducing your effective net yield from 4.5% down to approximately 3.19%. In contrast, holding S&P 500 index funds for over a year qualifies you for the preferential 15% long-term capital gains rate—and zero tax is owed as long as you hold the asset!
If you are currently managing high-interest consumer debt alongside savings, consult our step-by-step Debt Payoff Calculator & Strategy Tool to determine whether debt elimination yields a higher guaranteed return than either vehicle.
The Barbell Strategy: How to Use Both for Maximum Wealth
The smartest financial strategy is not picking between an HYSA or the stock market—it is combining them into a resilient “Barbell Allocation Strategy”. The HYSA serves as your ironclad defense, while the stock market serves as your aggressive offense.
Step 1: Build Your 3 to 6-Month Emergency Moat in an HYSA
Before investing a single dollar in equities, calculate your bare-bones monthly living expenses (rent/mortgage, utilities, groceries, insurance, debt minimums). Keep 3 to 6 months of this total in an HYSA. To determine your personalized 3 to 6-month safety net, test your living expenses with our free emergency fund calculator. If you are starting from zero, follow our actionable guide on how to save your first $1,000.
Step 2: Eliminate High-Interest Consumer Debt
If you carry credit card balances or personal loans charging 18% to 28% APR, paying off that debt delivers a guaranteed, risk-free return of 18% to 28%—far exceeding any HYSA or stock market return. Before parking extra cash in a savings account, eliminate any high-interest liabilities using a 0% APR balance transfer credit card to stop compounding APR fees. Use our Debt Payoff Calculator and review the debate on debt-free vs. having debt strategies to eliminate high-interest liabilities quickly.
Step 3: Capture Full Employer 401(k) Matching
An employer 401(k) match represents an instant 50% to 100% return on your money. Always contribute enough to capture the full match before allocating money anywhere else.
Step 4: Maximize Tax-Advantaged Growth (Roth IRA & HSA)
Open a Roth IRA and invest in low-cost, broad-market index funds (such as VOO, VTI, or FXAIX). By contributing after-tax dollars today, all future capital gains and dividend distributions will be 100% tax-free in retirement. Once your liquid cash reserve is secure, follow our strategic waterfall for allocating funds after maxing retirement accounts to build long-term, tax-efficient wealth.
Step 5: Automate Dollar-Cost Averaging for Excess Cashflow
Structure your monthly budget using our Interactive Budget Calculator. Route every surplus dollar into automated weekly or monthly index fund investments. By automating your contributions, you eliminate emotional market timing and harness long-term compounding.
Step-by-Step Action Blueprint: How to Deploy Your Money in 2026
Follow this exact 4-step financial order of operations to establish optimal balance between safety and growth:
- Step 1: Build Your Base Safety Floor in an HYSA: Calculate your core 3-to-6-month living expenses. Open an account with a top-rated FDIC-insured online bank and deposit this exact amount. Label this account "Emergency Fund" and leave it untouched for true crises.
- Step 2: Capture Your Employer 401(k) Match: Contribute enough to your workplace 401(k) to capture the maximum employer match (e.g., 100% return on your money instantly). Direct these funds into a low-cost S&P 500 or target-date index fund.
- Step 3: Maximize Your Roth IRA & HSA: Max out your annual Roth IRA and Health Savings Account contributions. Invest 100% of these balances into broad-market index funds (like
VOO,VTI, orFZROX) for decades of tax-free compounding. - Step 4: Automate Taxable Brokerage Dollar-Cost Averaging: Route any remaining surplus into a taxable brokerage account. Set up automated weekly or monthly recurring investments into S&P 500 index funds regardless of whether the market is at all-time highs or experiencing a temporary dip.
To organize your overall income and spending buckets, use our free Interactive Budget Calculator and explore our full pillar archive in Foundational Planning.
Expert Video Breakdown: $10,000 HYSA vs S&P 500
Watch this authoritative visual breakdown analyzing real-world returns, risk scenarios, and compounding math between a high-yield cash account and the stock market:
Frequently Asked Questions (FAQs)
Below are clear, expert answers to the most common questions regarding High-Yield Savings Accounts, stock market investing, and cash allocation in 2026:
An HYSA is the mandatory first step for beginners to build an emergency buffer without risking capital loss. However, once your 3 to 6-month safety net is funded, broad-market index funds (like the S&P 500) are vastly superior for building real wealth and beating long-term inflation.
In an HYSA, your nominal principal is 100% protected and FDIC-insured up to $250,000, meaning you cannot lose dollar value. In stocks, asset prices fluctuate constantly and you can experience paper losses during downturns, although historically diversified index funds recover and reach new highs over 5+ year horizons.
HYSA interest is taxed annually as ordinary income at your highest marginal tax rate (up to 37%+ federal). Stock investments held for over one year qualify for favorable Long-Term Capital Gains rates (0%, 15%, or 20%), and taxes are deferred entirely until you sell shares.
HYSA yields are variable and directly follow central bank interest rates. When the Federal Reserve reduces rates, HYSA yields will drop accordingly (e.g., from 4.5%-5.0% down to 3.0%-3.5%—read our actionable strategy on where to park cash during Fed rate cuts). In contrast, equity valuations frequently benefit when interest rates fall due to lower corporate debt expenses.
Always keep your emergency cash in an FDIC-insured High-Yield Savings Account (HYSA) or a Treasury Money Market Fund. Never put your emergency fund in stocks, crypto, or illiquid real estate where market volatility could force you to sell at a loss during an emergency.
A proven standard is maintaining 3 to 6 months of necessary living expenses in an HYSA. Any surplus beyond this emergency cushion and near-term planned purchases (within 1-3 years) should be systematically invested in index funds to prevent severe cash drag.
The S&P 500 has averaged roughly 10.2% annualized returns over the past century (~7.1% adjusted for inflation). In contrast, HYSAs currently earn between 4.0% and 5.0% APY during high-interest cycles, but typically yield between 0.5% and 2.0% during standard economic environments.
Absolutely. Utilizing both tools concurrently is the cornerstone of sound personal finance. Your HYSA provides defensive stability and immediate liquidity, while your S&P 500 portfolio drives offensive wealth compounding.
Bank deposits are backed by the full faith and credit of the U.S. government through federal deposit insurance up to $250,000 per depositor. Consult the official Federal Deposit Insurance Corporation (FDIC) Deposit Insurance Overview for statutory guidelines and consumer protections.
If you decide to hold liquid cash before deploying into the market, use these optimized banking playbooks:
- Top Annual Yields: best high-yield savings accounts (HYSA) of 2026 comparing FDIC insurance, compounding frequency, and zero-fee yields.
- Emergency Reserves: the complete emergency fund and HYSA master guide calculating exact liquid months before taking equity market risk.
- Real Estate Savings: how to save for a house down payment in cash protecting your capital against stock market volatility before closing.
- Buffer Sizing: 3 months vs 6 months emergency fund calculation tailoring safety buffers to dual vs single income households.

Jaiveer Hooda is the Lead Financial Researcher & Personal Finance Analyst at Grow Your Money Smart. Specializing in personal wealth optimization, index fund compounding, high-yield savings mechanics, and consumer debt elimination strategies. With a background in computer engineering, he applies mathematical modeling, cashflow simulations, and empirical risk analysis to evaluate personal finance vehicles and credit products. Every analysis is backed by verified regulatory disclosures, IRS tax schedules, and empirical APY compounding math.
Areas of Expertise: Personal Finance · High-Yield Savings Accounts (HYSA) · Index Funds & S&P 500 Compounding · Retirement Planning (401k/IRA) · Debt Optimization · Credit Card APR Mechanics.
Transparency & Editorial Policy: Editorial Standards | Report a Correction